
In the previous post we went through setting up AD Authentication and role based access in vRealize Log Insight (vRLI).
Part 1: VMware vRealize Log Insight Install and Configure – TheSleepyAdmins
Part 2: VMware vRealize Log Insight AD Authentication and Role Based Access – TheSleepyAdmins
In this post we will be going through querying logs and creating a Dashboard.
vRealize Log Insight collects, imports, and analyzes logs to help with troubleshooting problems with systems, services, and applications.
You can search and filter log events on the Interactive Analytics tab, Logs can be queried using different filters like text, timestamp, source, fields and Regular Expressions
| Type | Description |
| Timestamp | The time when the event occurred |
| Source | Where the event originated. This could be the originator of the syslog messages such as an ESXi host or a forwarder such as a syslog aggregation. |
| Text | The raw text of the event. |
| Fields | A name-value pair extracted from the event. Fields are delivered to the server as static fields only when an agent uses the CFAPI protocol. |
Below is the user guide for vRLI
Using vRealize Log Insight – vRealize Log Insight 8.2 (vmware.com)
First we will be going through querying logs.
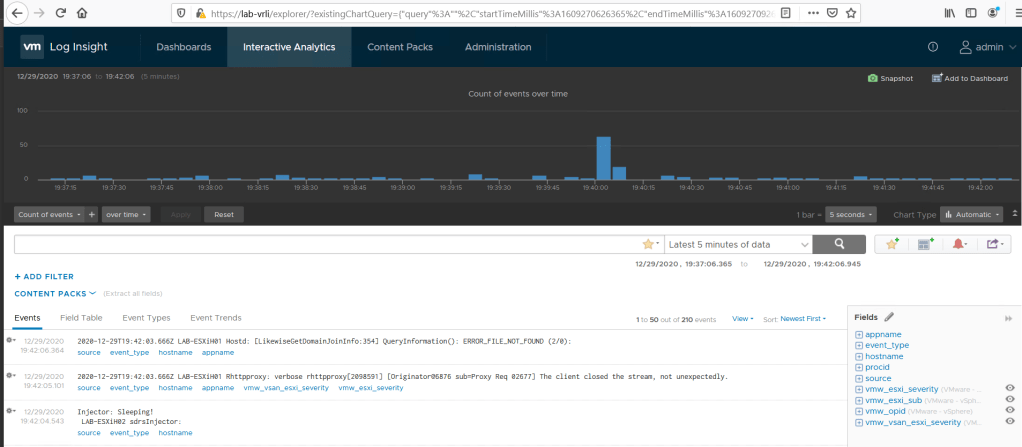
Open vRLI > Interactive Analytics, This will show all logs to query use the Add filter button
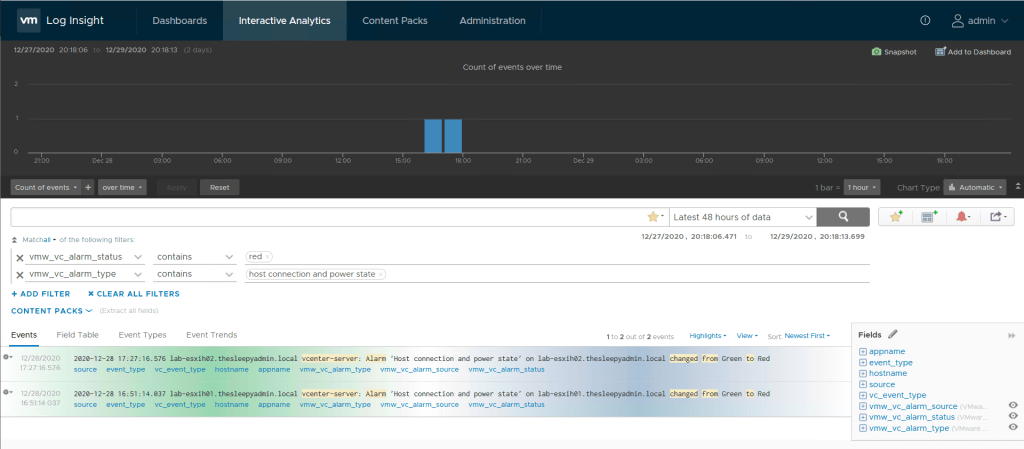
In the below we are going to query any hosts that have disconnected over the last 48 hours. Below are the two filters I used for the host disconnections.
vmw_vc_alarm_status contains Red
vmw_vc_alarm_type contains host connection and power state
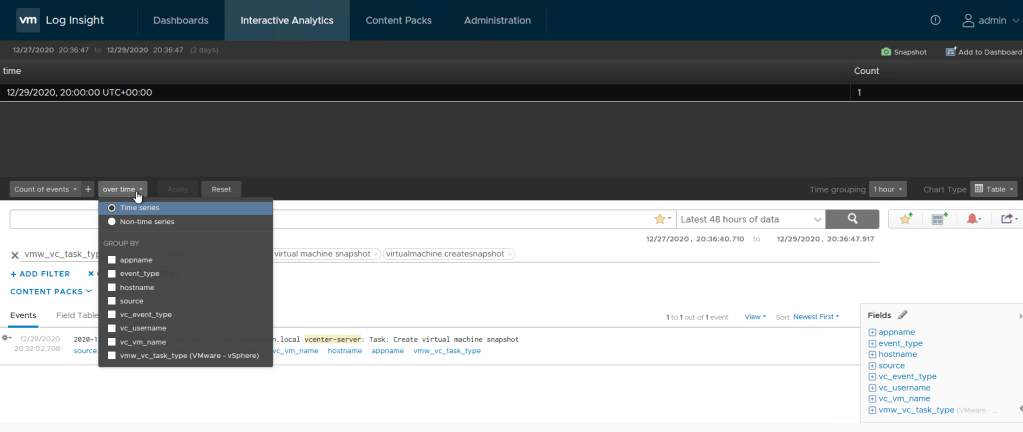
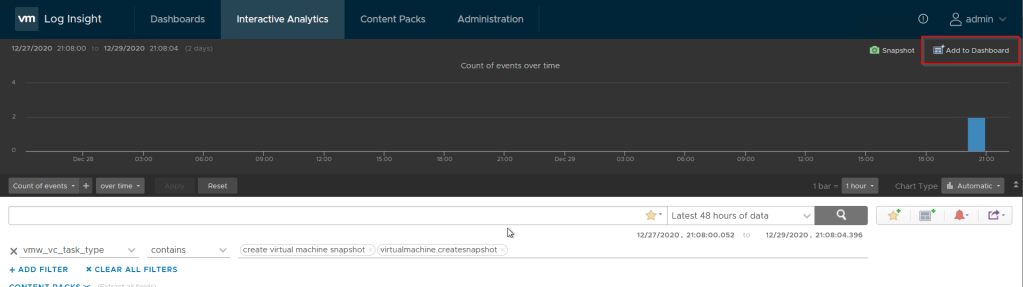
We create a table view for events. Below is for snapshots taken in the last 48 hours , we can then add additional information by clicking on time series button and adding group by fields.
vmc_vc_task_type contains create virtual machine snapshot and virtualmachine.createsnapshot
I wanted to add the users that created the snapshot, source and VM name.
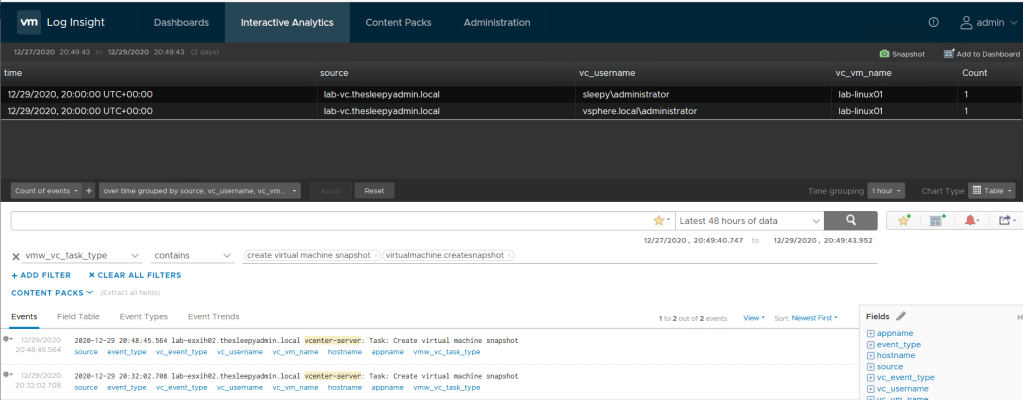
There are a lot of different event types that can be queried and it will all depend on what event’s you are looking for.
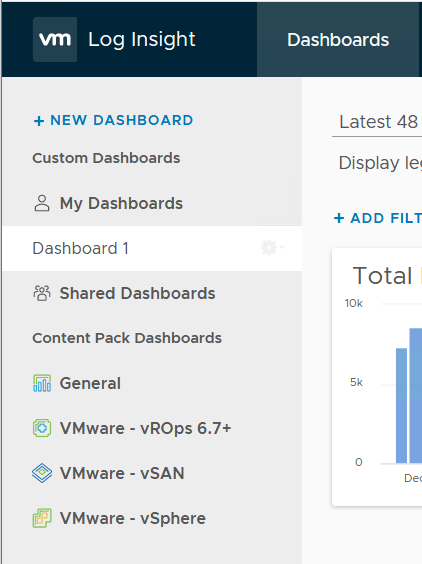
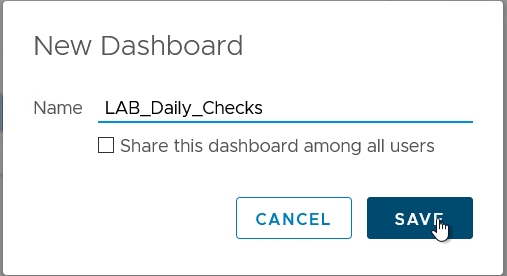
Next we will create a dashboard with a few different queries. To create a new dashboard go to Dashboards > New Dashboard
Give the Dashboard a name and select if it should be shared with all users.
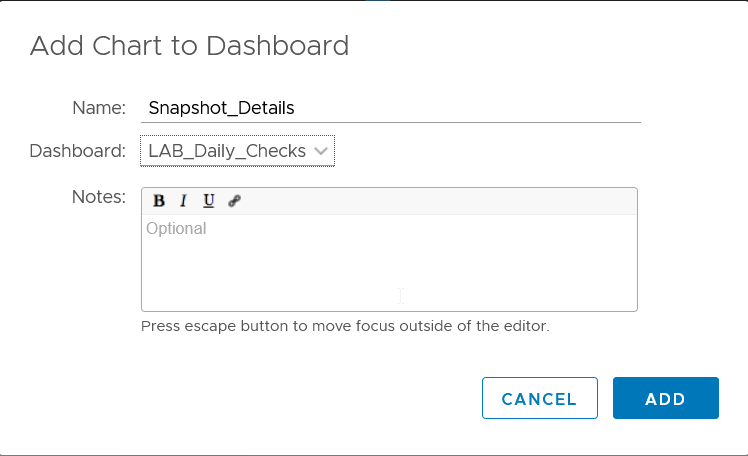
Create a filter and click Add to Dashboard
Give the filter a name
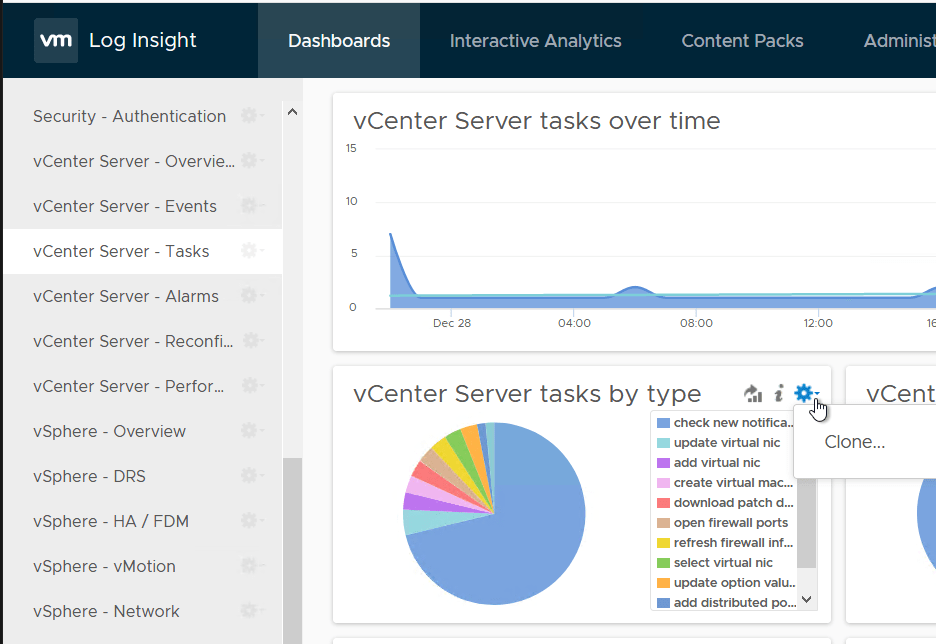
If there are any existing filters that are currently in any other dashboard they can be cloned to your custom dashboard by clicking on the the gear icon and selecting clone, then select your custom dashboard.
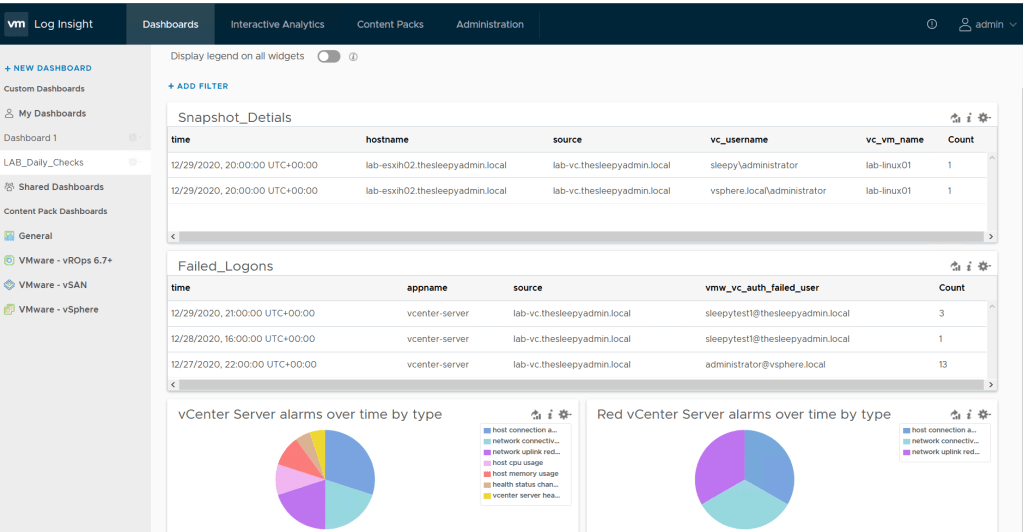
Once all the required queries are added to the dashboard we can go to My Dashboards to view.
In the next post we will go through adding a Windows agent and adding the content pack for Windows.
