In this post we will be going through using the different KQL operators
First we will use the search operator to return all data in the log workspace, this can be useful when trying to find a the table we want to query or see specific event type.
search *
If we want to return specific number for of rows but not in specific order we can use take 10
Table
|take  10
To return a list of unique values in a column we can use distinct.
Table
| distinct AppDisplayName
To select multiple rows we can use the or operator
Table
| where colume_name contains "value" or colume_name  contains "value" Signup Portal"
| project  value1, value2
To order the data we can use order by
Table
| where colume_name contains "value" or colume_name  contains "value" Signup Portal"
| order by type
| project  value1, value2
To return the first set to rows we can use top
Table
| top 10 by colume_name
| project value1
To return data between a specific date and time we can use the between operator
Table
| where TimeGenerated between (datetime(2023-08-14T19:12:00) .. datetime(2023-08-15T19:12:00))
In the next post we will go through Query and Structure Data, as well as creating data in visualizing data in charts using the render operator.
Kusto Query Language (KQL), is a query language developed by Microsoft for querying and analyzing data. KQL is specifically designed for working with structured, semi-structured, and unstructured data, and it offers a simple and intuitive syntax for expressing complex queries.
KQL is used in log analytics, security monitoring, and business intelligence. It allows users to extract insights from vast amounts of data by using a combination of filtering, aggregating, and transforming operations. With its rich set of operators, functions, and control flow statements, KQL enables users to perform advanced analytics and create sophisticated queries.
In the next few blog post’s we will be going through how to send data to a log workspace and creating KQL queries to show how we can visualize and gather data.
I have wanted to do more with KQL and I am using this series to improve my own KQL and hopefully it will be of use to other if you are just starting out.
First step is we need to create a Azure Log workspace.
Go to Log Analytics workspace blade in Azure and click create.
Select a subscription
Create or select and existing resource group
Give the workspace a name
Set the region
Select tags if needed, review and create.
It will take a few minutes to finish deploying.
Once we have the log workspace created we can start to send data that we can then query.
First we will be sending storage account diagnostic data.
To enabled to go the storage account and select diagnostic settings.
Enabled the diagnostic for the required storage type, I am going to enable for blob and file.
Click on the storage type and click add diagnostic settings.
Select the logs to send and the log analytics workspace.
After enabling for both file and blob the diagnostic status should now show as enabled.
We will can generate some data by creating and delete some blob and azure file share.
Once we have some data can start to write our KQL query. First we can run against the full table by using StorageBlobLogs. I used the Azure monitor reference to find the correct table to use.
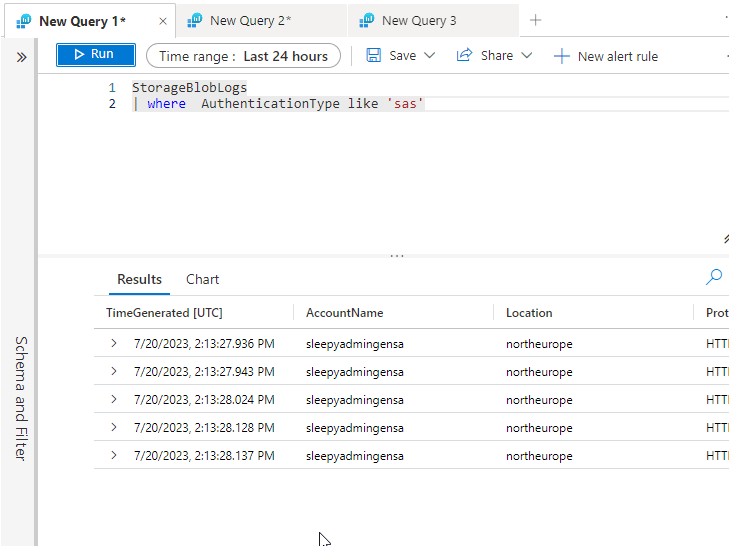
If we want to select specify rows and filter the data that is returned we can use the where operator. In below example I am select only the storage write results.
StorageBlobLogs
| where Category == 'StorageWrite'
In the next post we will go through using different operators like project, summarize, rendering…