In the previous seven post’s we went through installing and configuring the vROps virtual appliance, connecting to vCenter server, configuring Window Active directory as an identity source, create custom alerts and notifications, creating dashboards, upgrading the appliance to the latest version and requesting / configuring a custom SSL cert.
Part 1: Install and Configure vRealize Operations Manager 8.2 Part 1 – TheSleepyAdmins
Part 2: Install and Configure vRealize Operations Manager 8.2 Part 2 Connect to vCenter – TheSleepyAdmins
Part 3: Install and Configure vRealize Operations Manager 8.2 Part 3 AD Authentication – TheSleepyAdmins
Part 5: Install and Configure vRealize Operations Manager 8.2 Part 5 Create a Dashboard – TheSleepyAdmins
Part 6: Install and Configure vRealize Operations Manager 8.2 Part 6 Upgrading vROps – TheSleepyAdmins
In this post we will be going through installing the Windows agent and configuring the management pack to alert on Windows server OS level alerts like performance, services and application. This can be useful for monitoring physical servers running Windows.
Below is a link to the VMware document on vROps agent deployment I used for reference.
End Point Operations Management Agent Installation and Deployment (vmware.com)
Below is the list of support Operating system for vROps agent.
| Operating System | Processor Architecture | JVM |
|---|---|---|
| RedHat Enterprise Linux (RHEL) 5.x, 6.x, 7.x | x86_64, x86_32 | Oracle Java SE8 |
| CentOS 5.x, 6.x, 7.x | x86_64, x86_32 | Oracle Java SE8 |
| SUSE Enterprise Linux (SLES) 11.x, 12.x | x86_64 | Oracle Java SE8 |
| Windows 2008 Server, 2008 Server R2 | x86_64, x86_32 | Oracle Java SE8 |
| Windows 2012 Server, 2012 Server R2 | x86_64 | Oracle Java SE8 |
| Windows Server 2016 | x86_64 | Oracle Java SE8 |
| Solaris 10, 11 | x86_64, SPARC | Oracle Java SE7 |
| AIX 6.1, 7.1 | Power PC | IBM Java SE7 |
| VMware Photon Linux 1. 0 | x86_64 | Open JDK 1.8.0_72-BLFS |
| Oracle Linux versions 5, 6, 7 | x86_64, x86_32 | Open JDK Runtime Environment 1.7 |
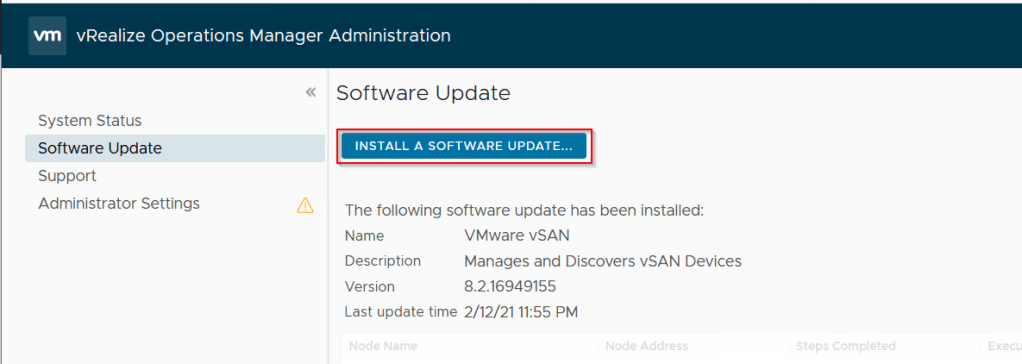
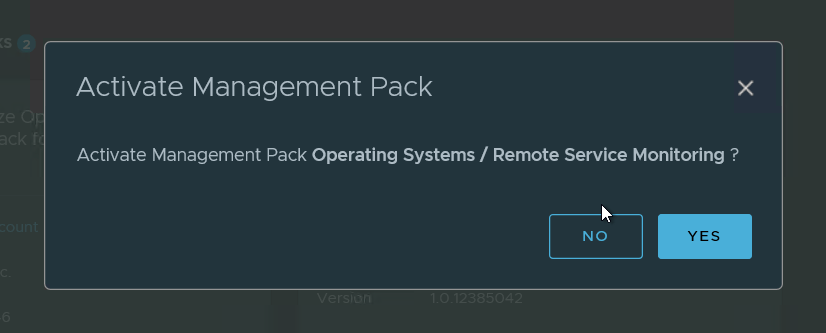
First we need to enabled the management pack for Operating Systems / Remote Services Monitoring.
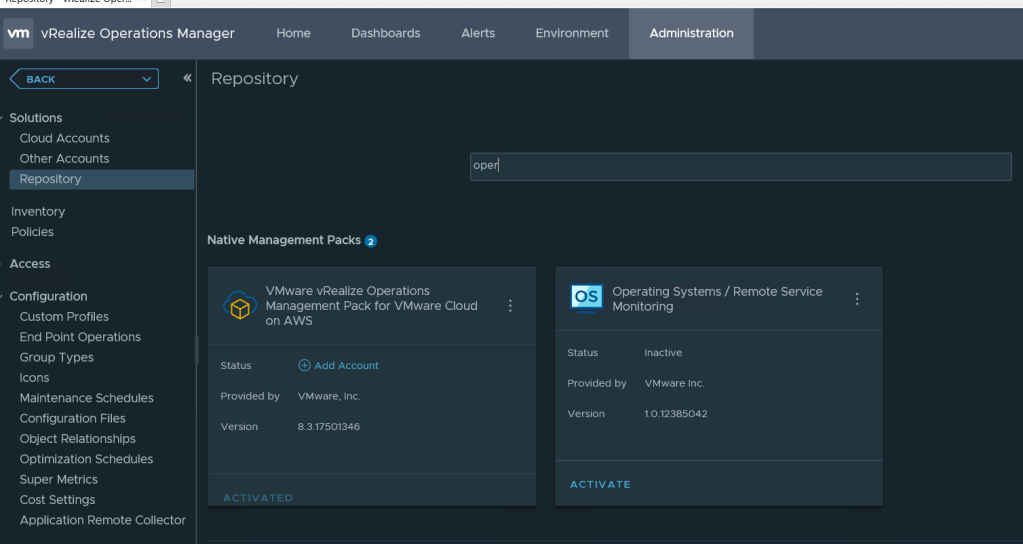
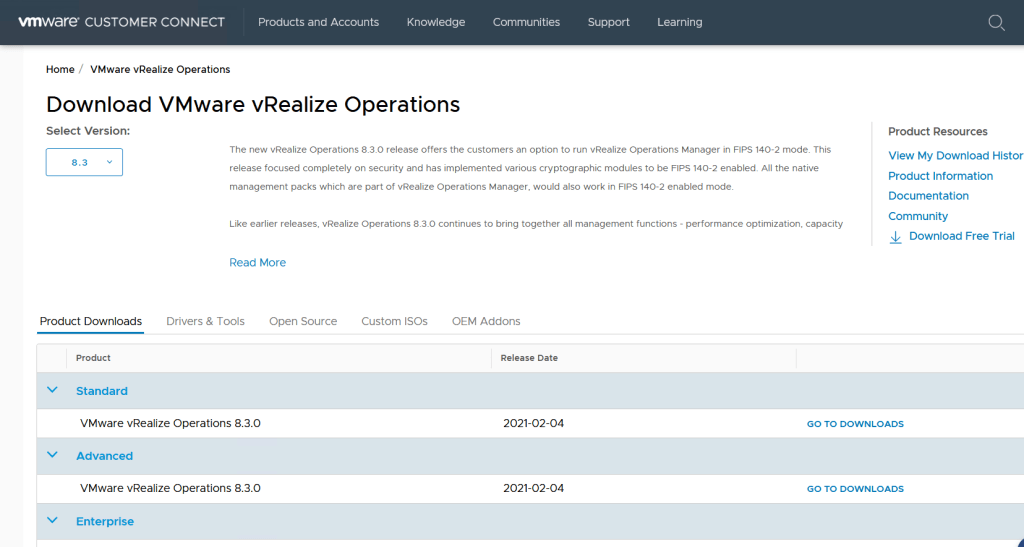
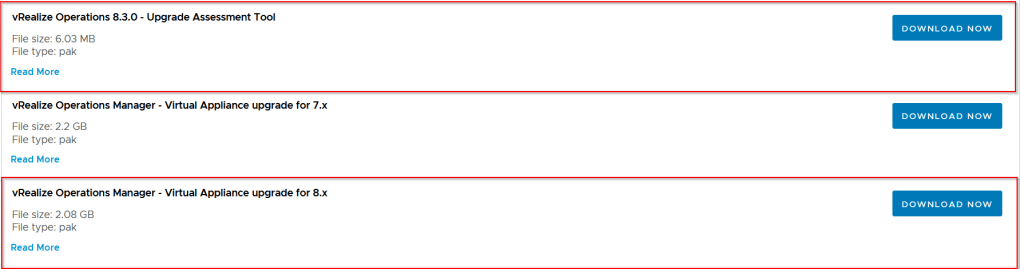
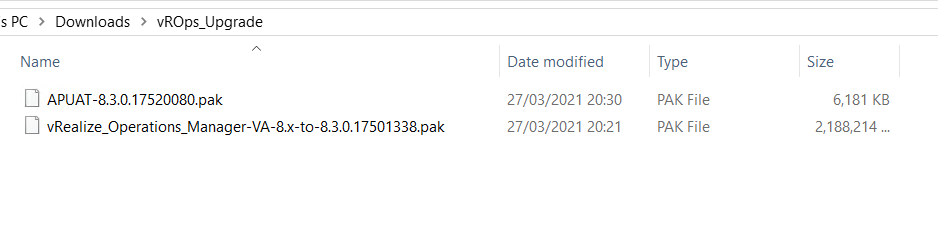
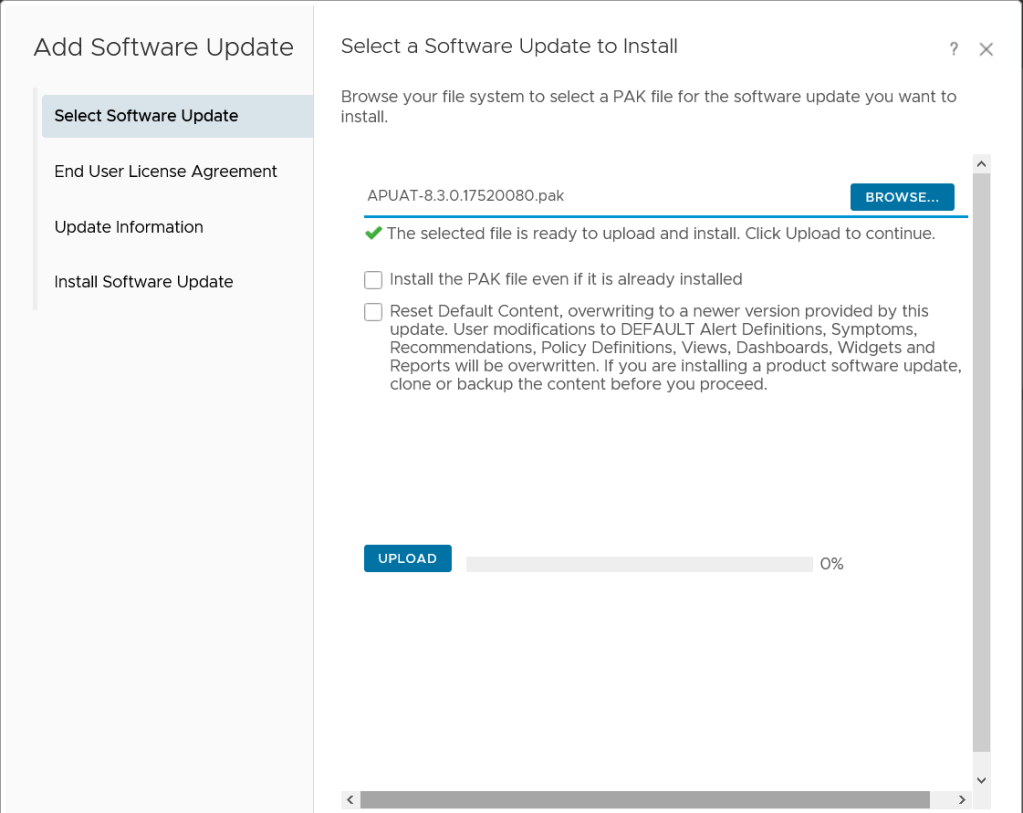
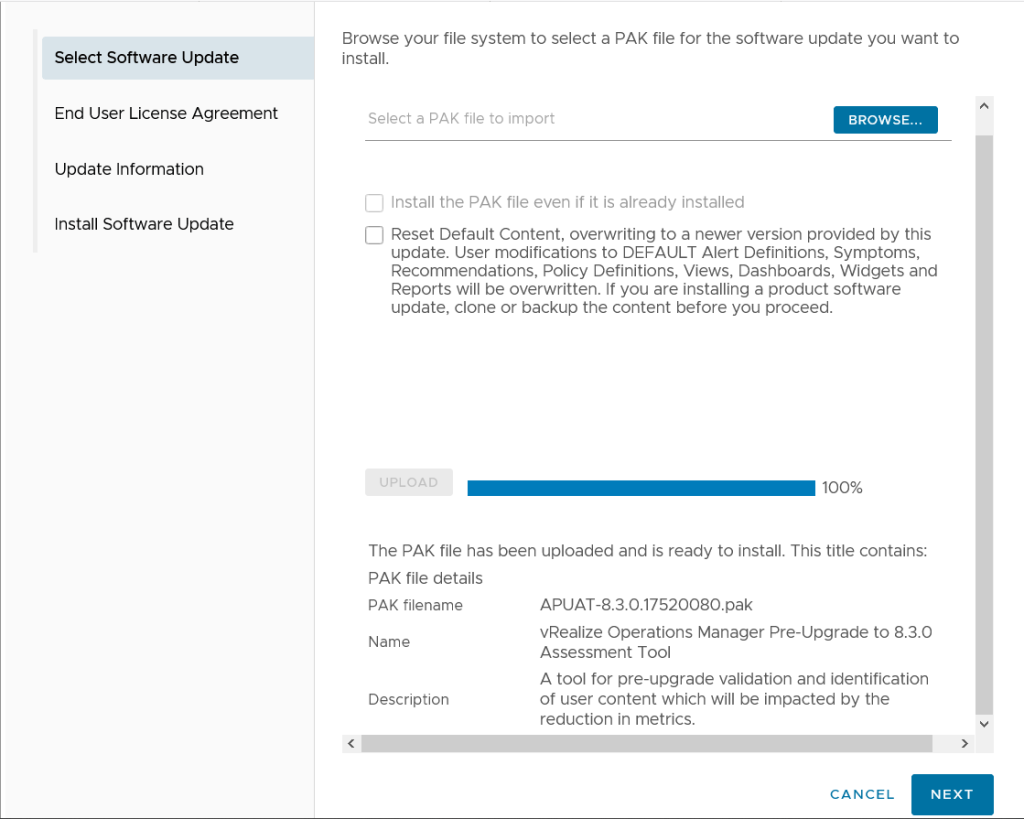
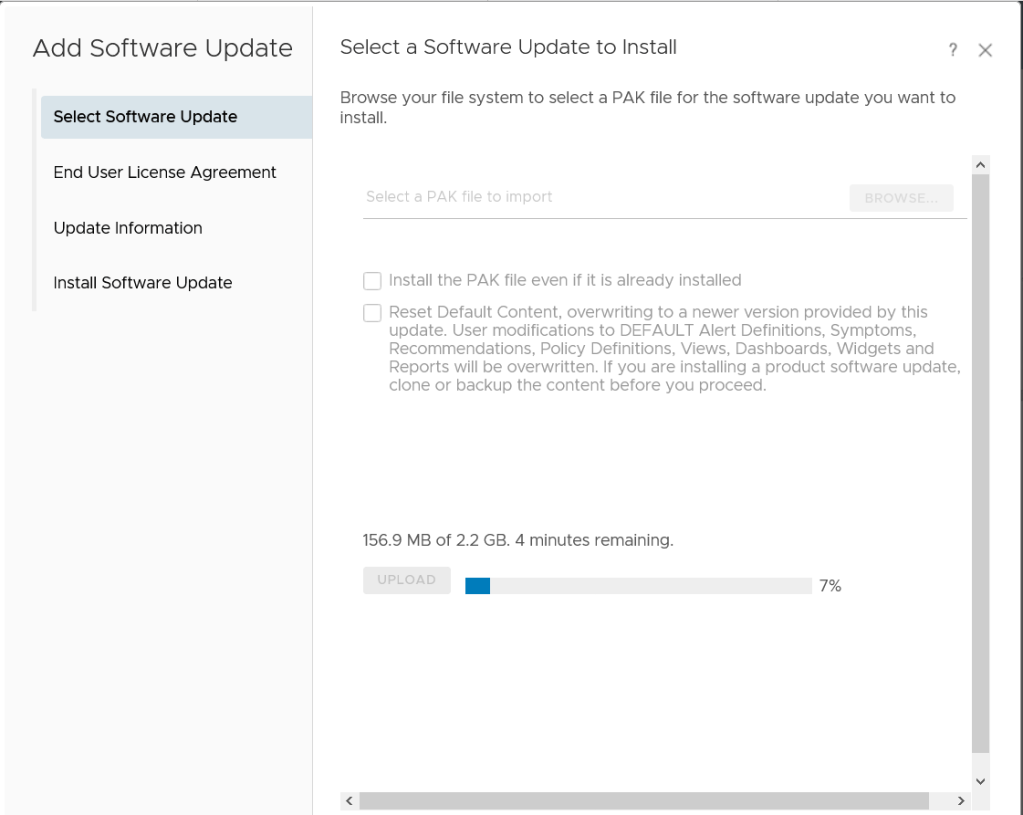
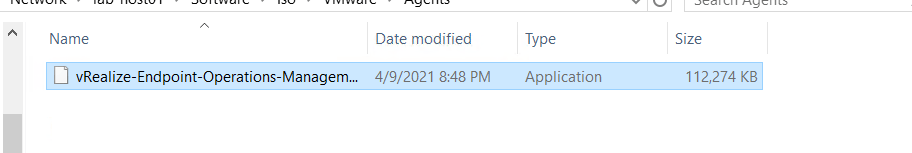
After the management pack is enabled we need to download the agent, the 8.2 version works for both 8.2 and 8.3 and is available to download on the same page as the vROps appliance.
Download vRealize Operations – My VMware

Once we have the agent, we can deploy to the servers that need to be monitored.
Copy the file to the server and run installer.
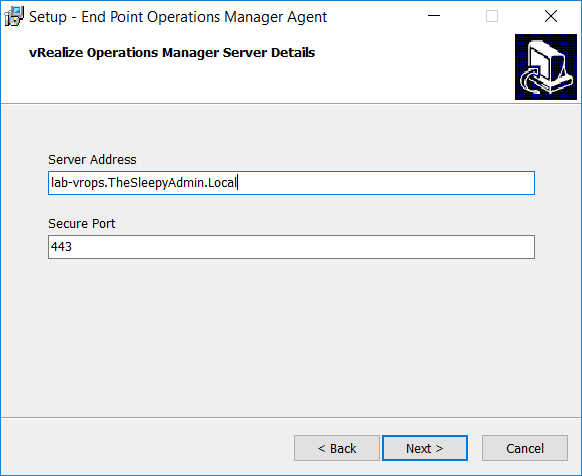
Add in the vROps server when prompted to
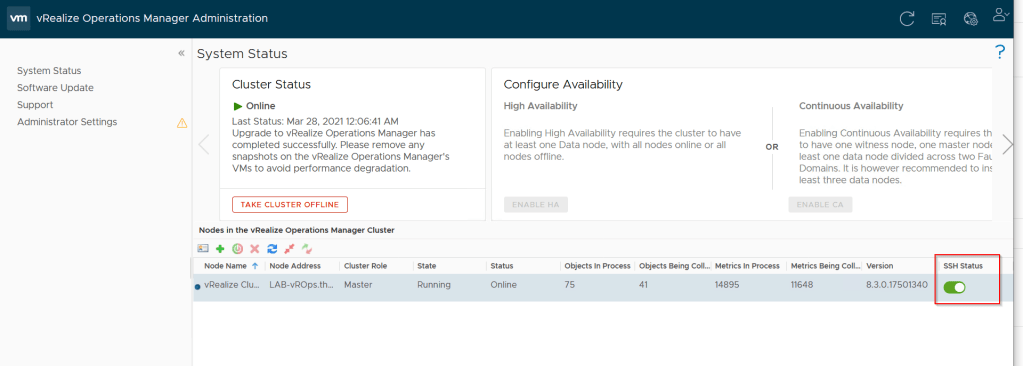
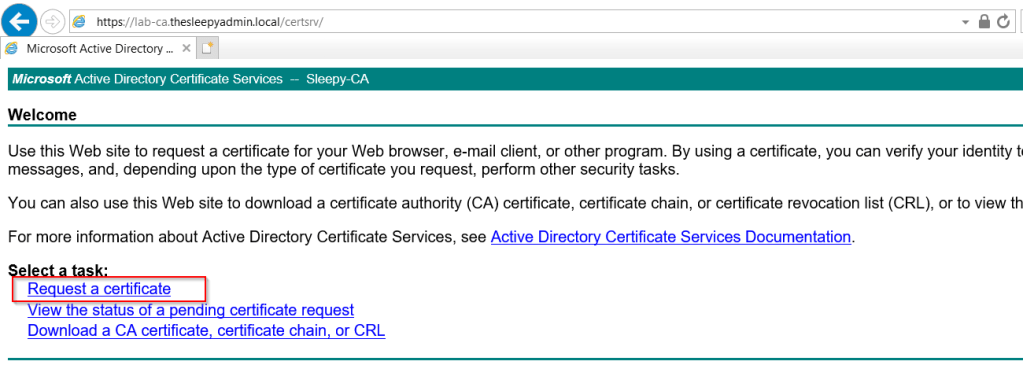
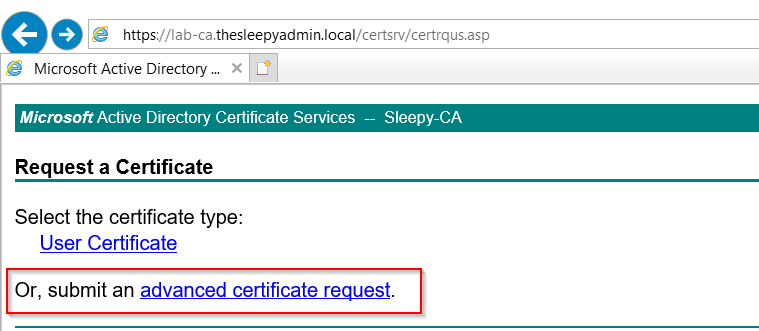
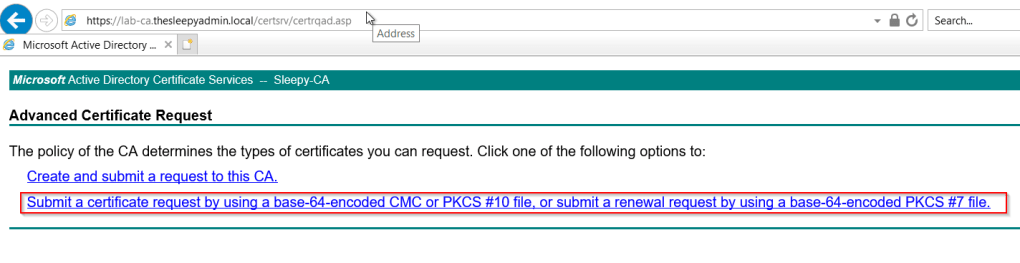
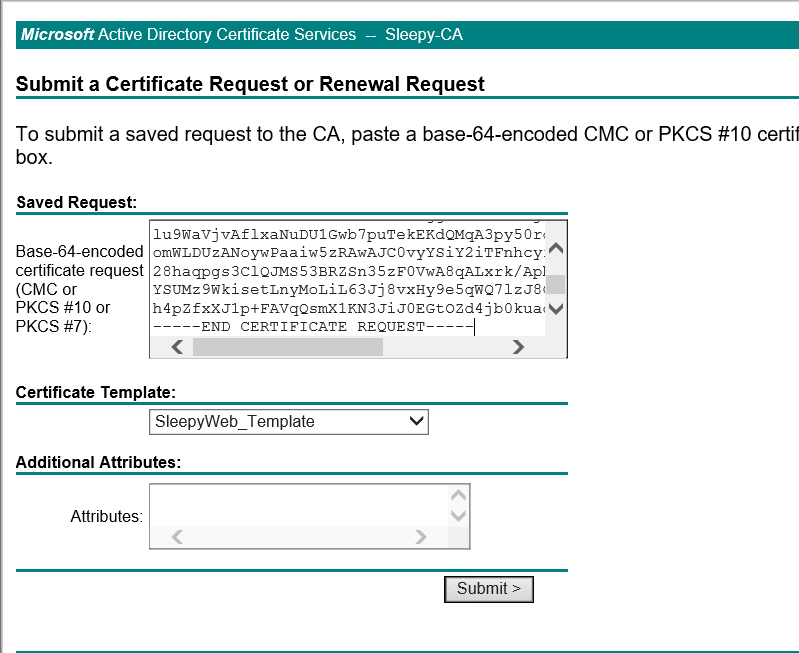
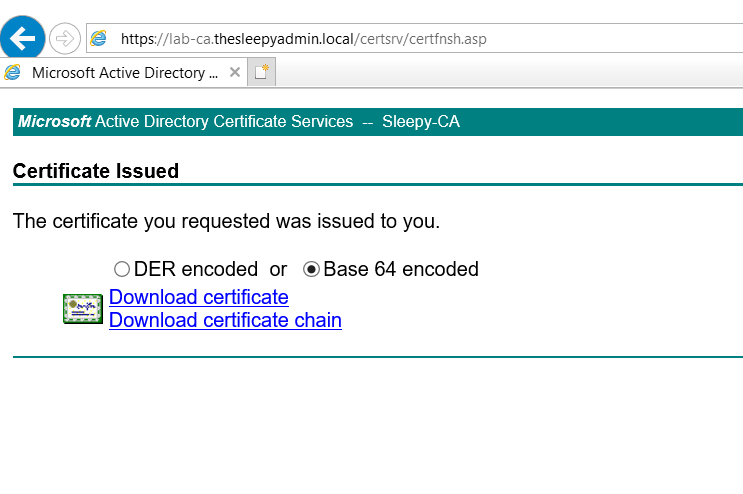
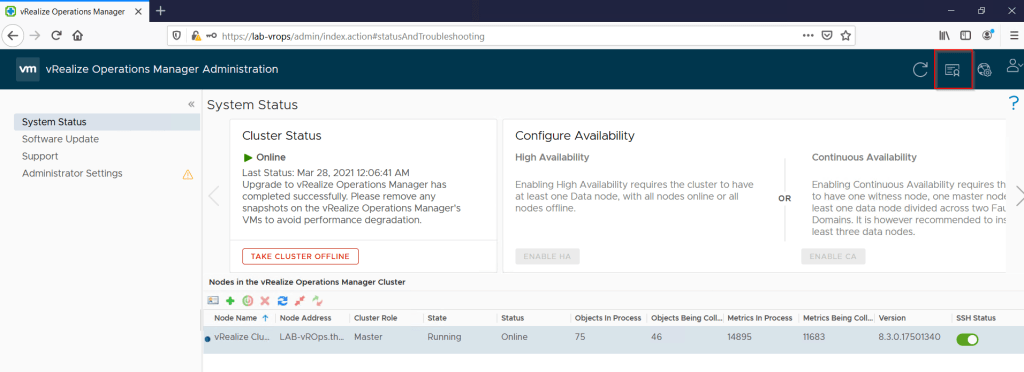
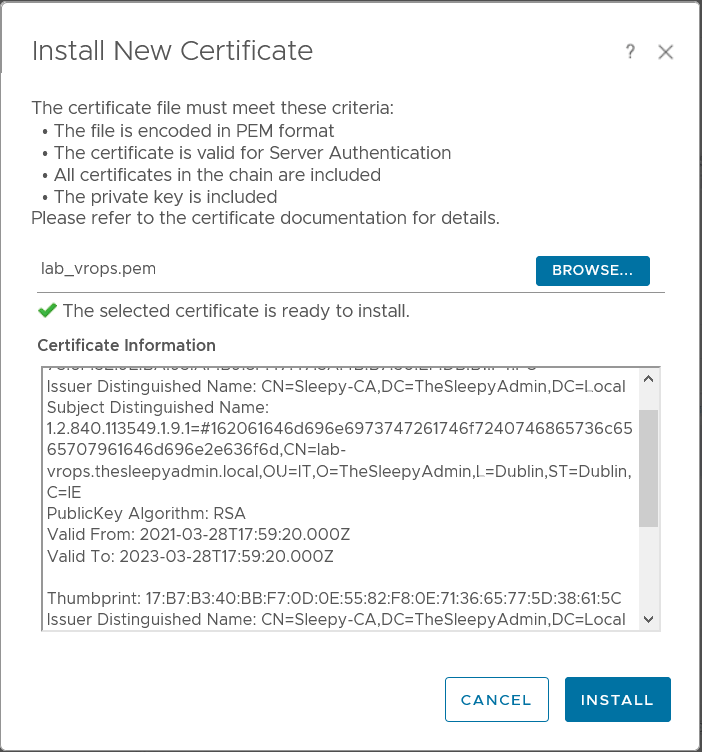
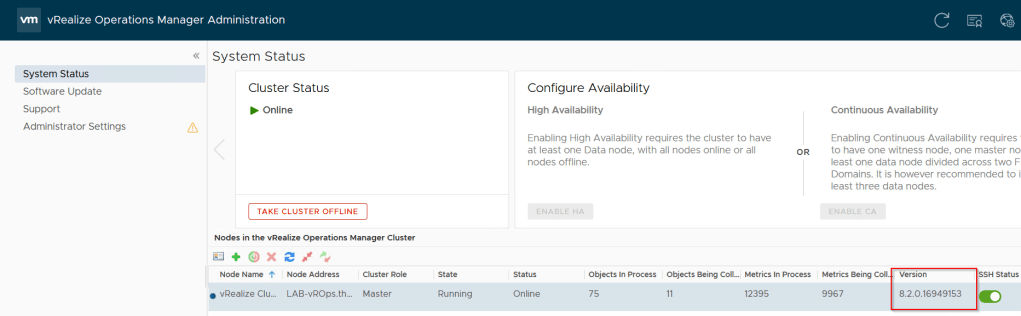
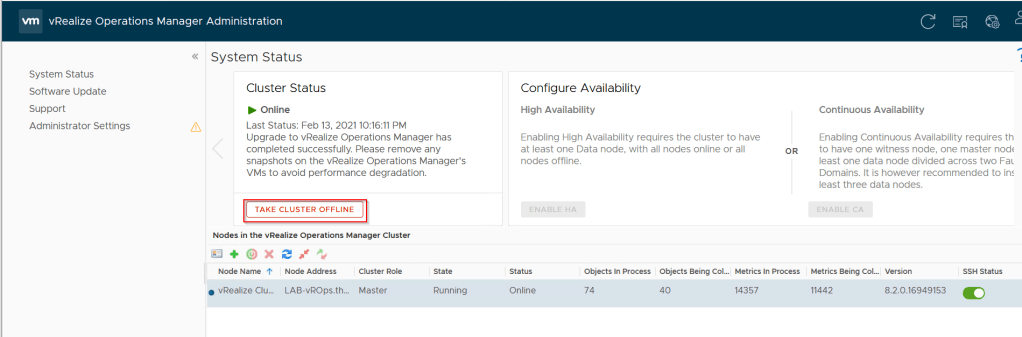
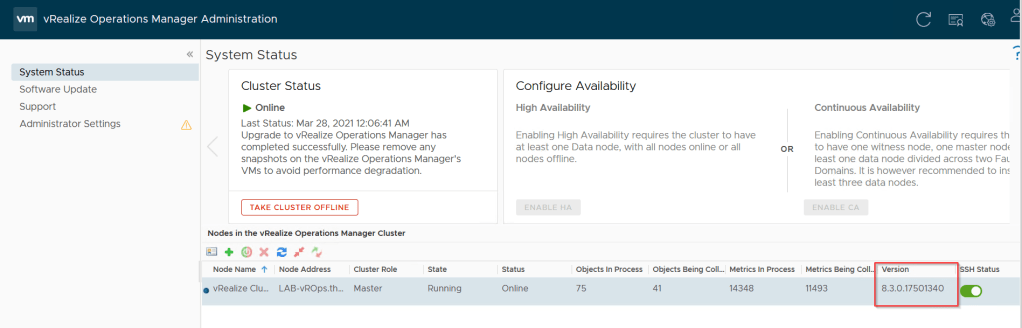
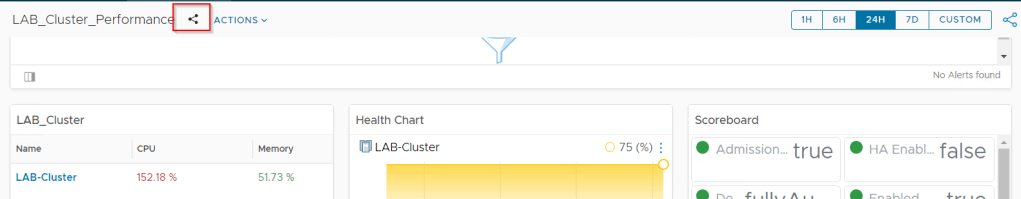
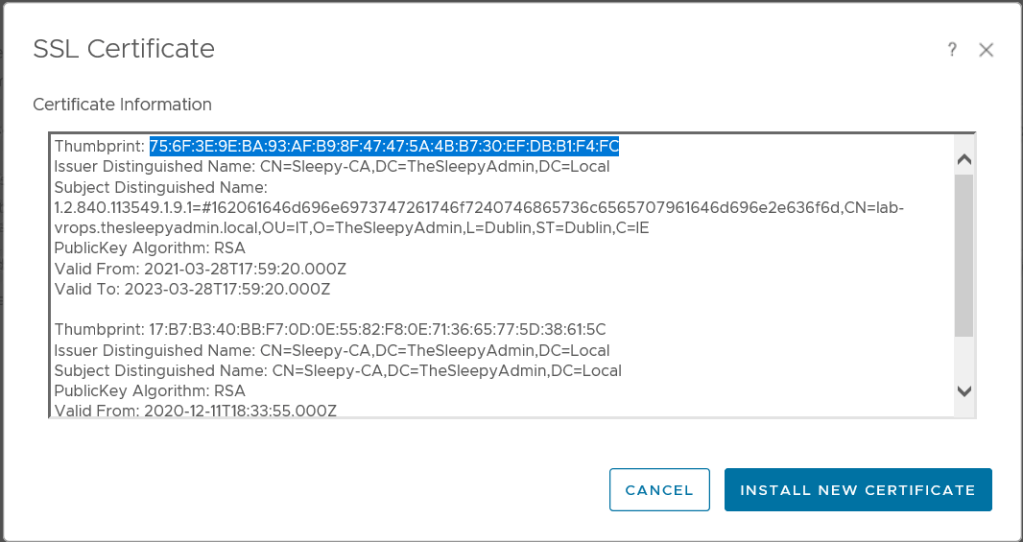
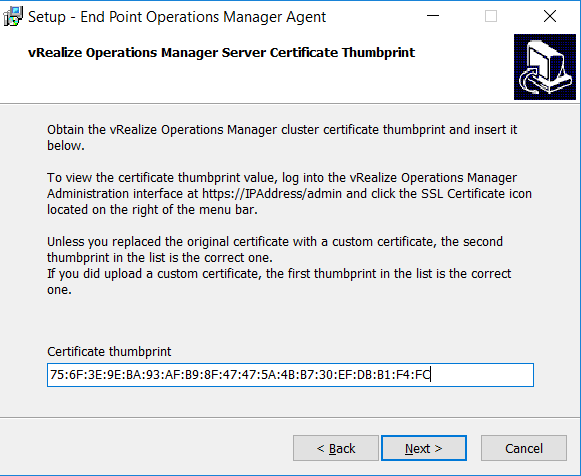
Next the installer will look for the thumbprint for the cert that is used for vROps. Logon to https://vrops/admin and click on the cert icon on the top right to view the current cert details.
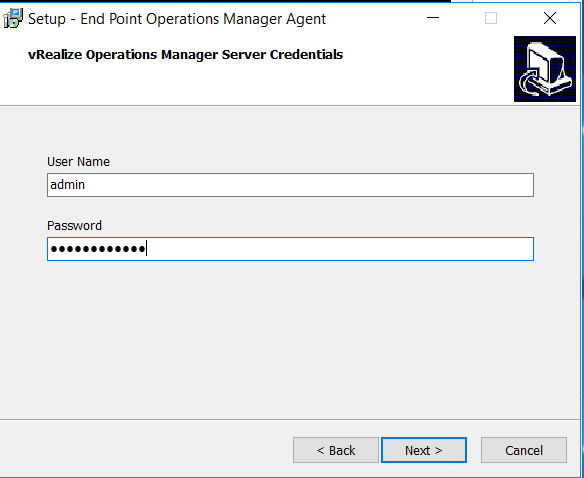
Enter the user name and password that will be used to connect to vROps.
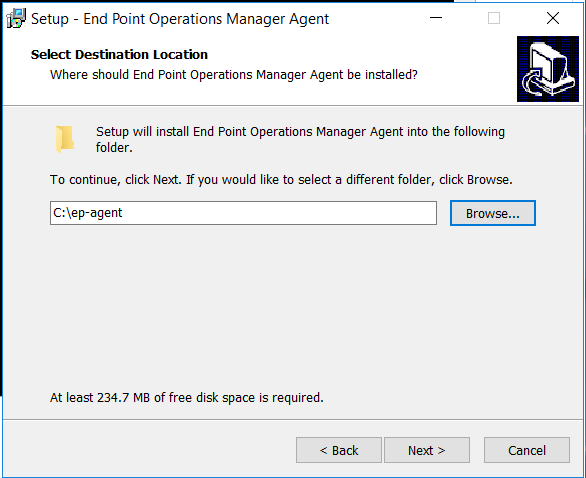
Set the install location the default is to install in c:\ep-agent this can be change if required.
The agent should now start to install.
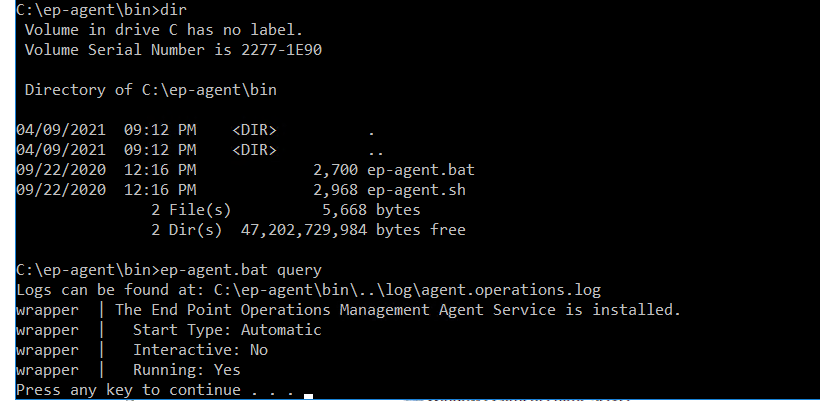
We can run ep-agent.bat query from the install folder ep-agent\bin to confirm the agent has installed correctly.
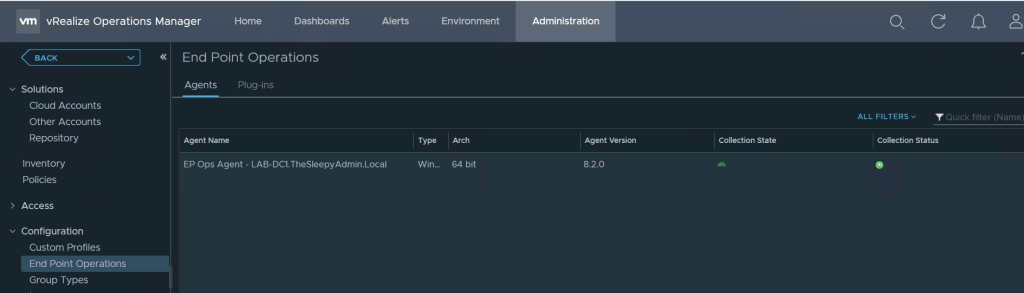
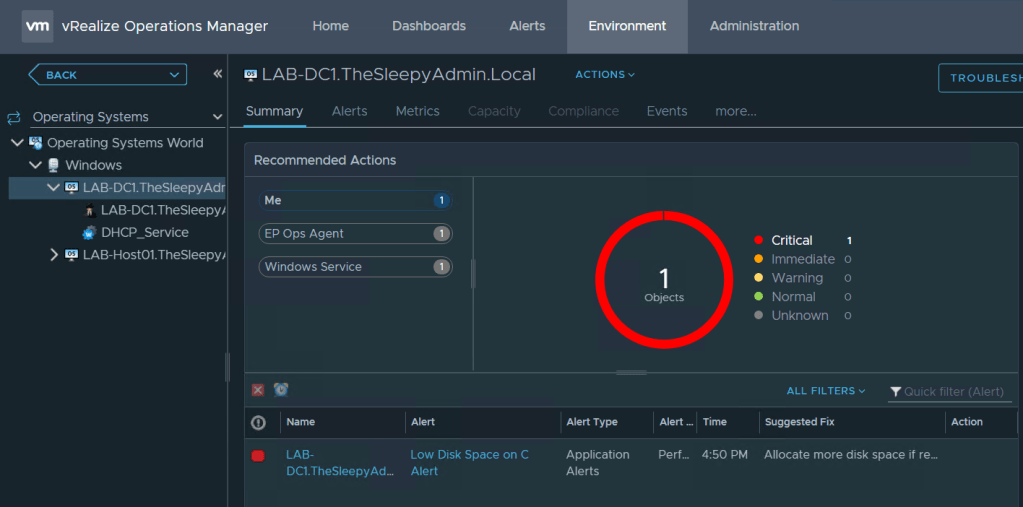
Once completed we can check vROps to confirm the agent is reporting back, to view the agent in vROps logon to the web client > Administration > End Point Operations.
To view details for the server go to Environment > Operating Systems > Operating System World > Windows and select the server to view.
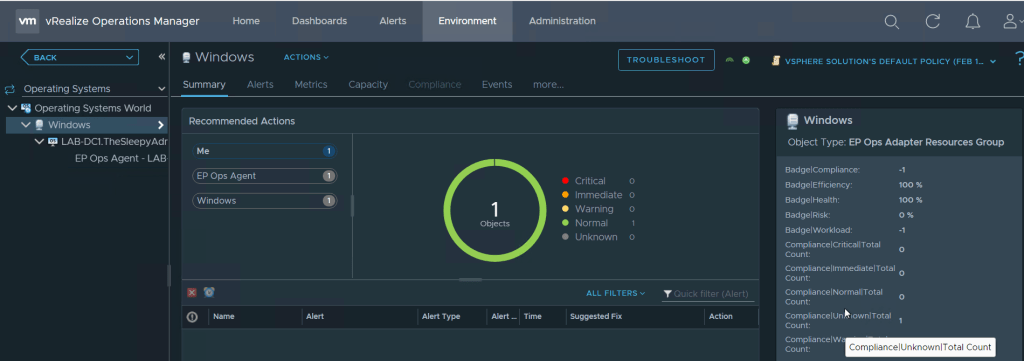
Once the server is added we can now monitor disk, CPU, memory and other metrics.
We can also monitor services.
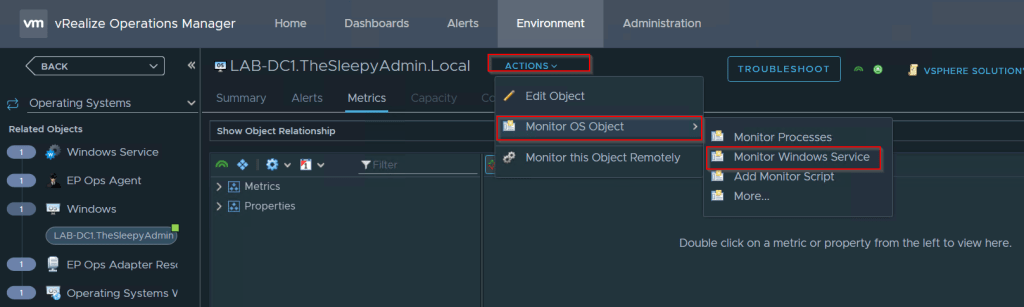
To add a service to be monitored,
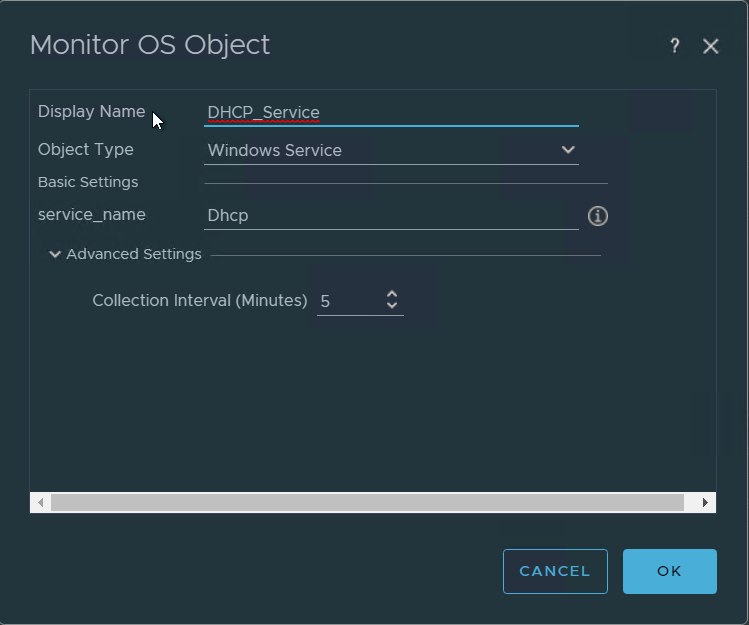
Go to server and click on action > monitor os object > monitor windows service
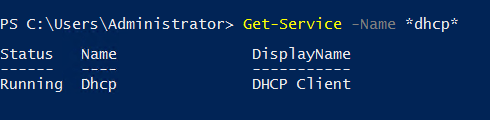
Give the monitor a name, select the object type and add in the service name (this needs to be the actual name and not the display name)
Set the collection interval. Click ok to to create the monitor.
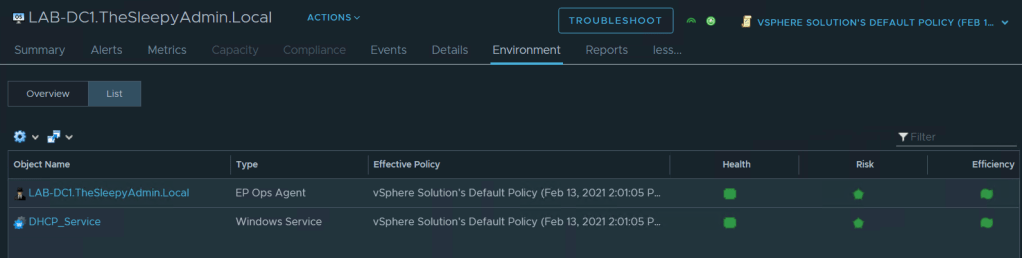
Click on Environment and we can view the service monitor we just added.
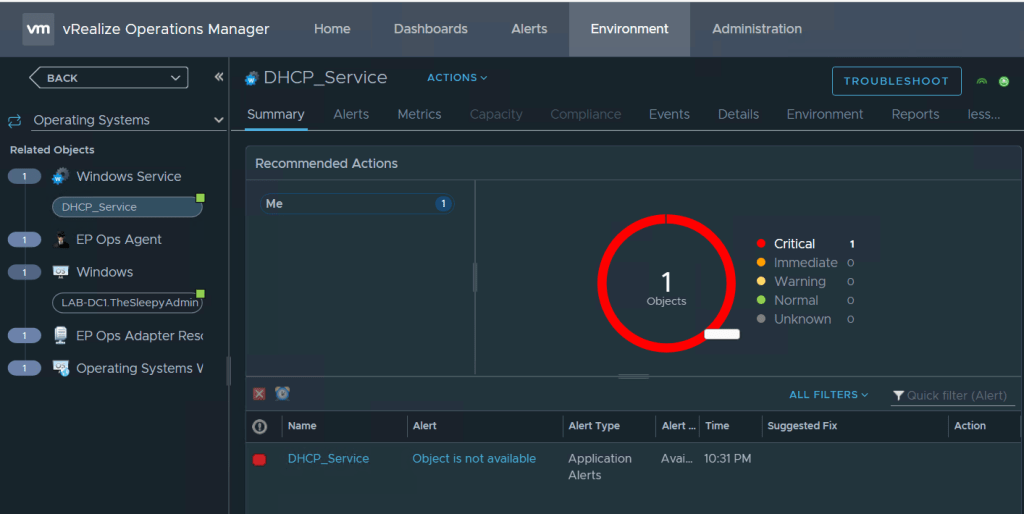
If we stop the service the next time the collection runs the service should show a critical alert.
We can add addtional metrics if needed. In this example we might want to see the logical disk space % free.
First we either need to modify the existing policy or create a new policy.
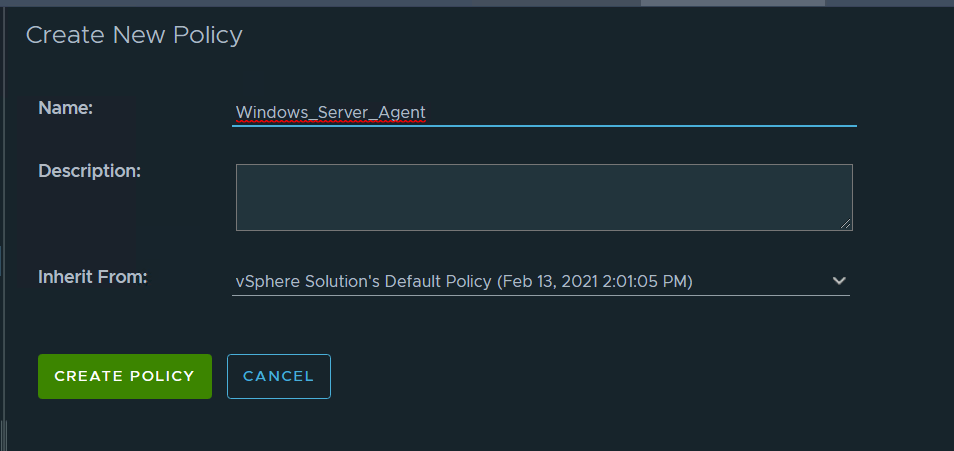
In this example we will be adding a new policy and inherting from the default policy.
Go to Policies and click add, give the policy a name and select where it will be inherit from. Then click create policy.
Go to the policies and click on the policy we just created and go to edit policy.
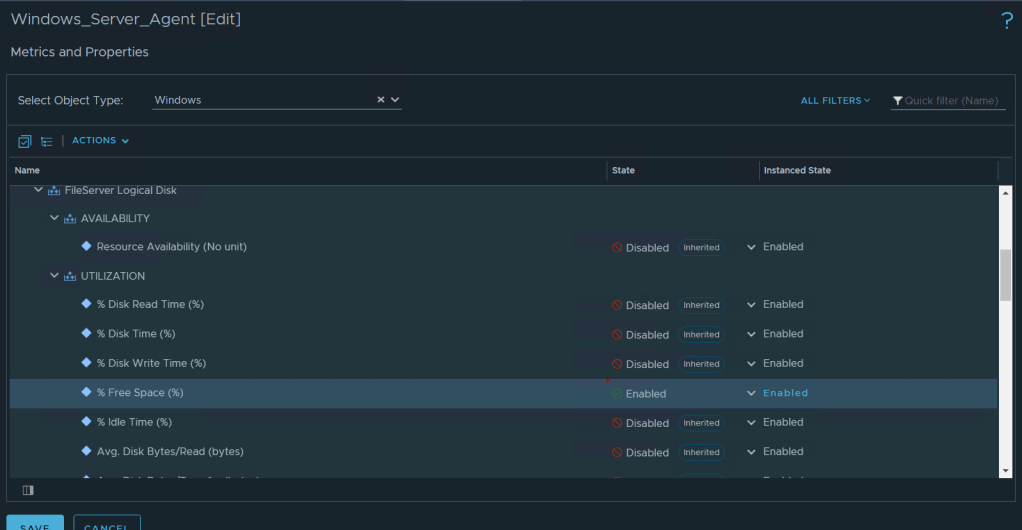
We will be adding a metric so we will select metrics and properties and enable the required metrics.
% free is under EP Ops Adapter > Windows >Fileserver Logical Disk > Utilization and % Free space (%).
Set the policy state to enabled.
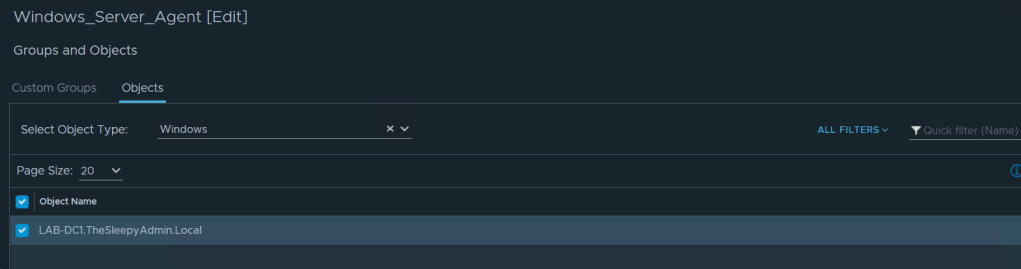
Next we can apply the policy to either the object or if there are a lot of device it would be easier to create and apply to a custom group.
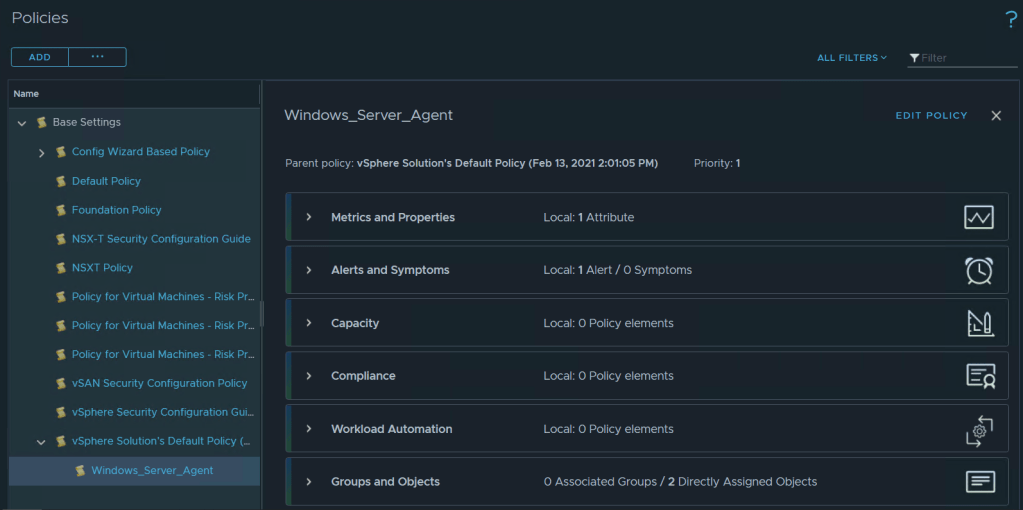
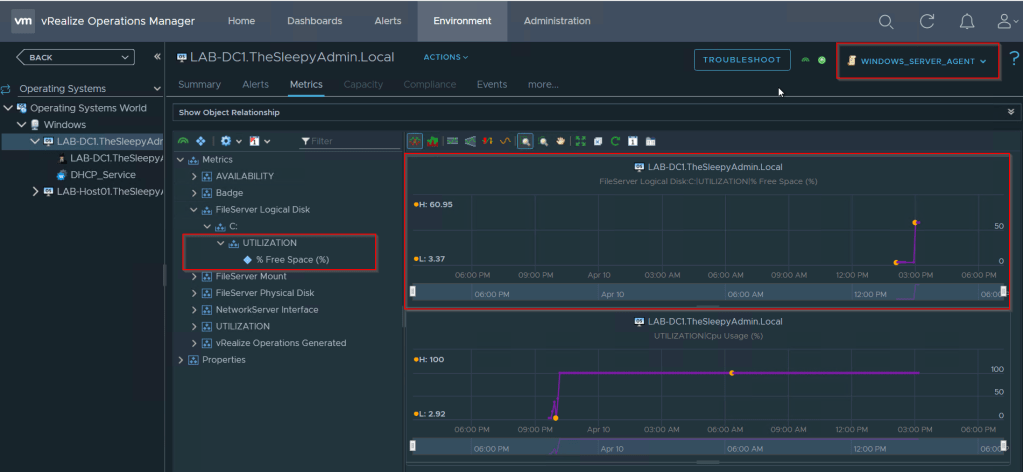
Now we can go to the server and confirm the policy is applied.
After a few minutes we can check the server object we can see the new metric and the data start to be shown.
Now that we have the metric showing next we can create an alert.
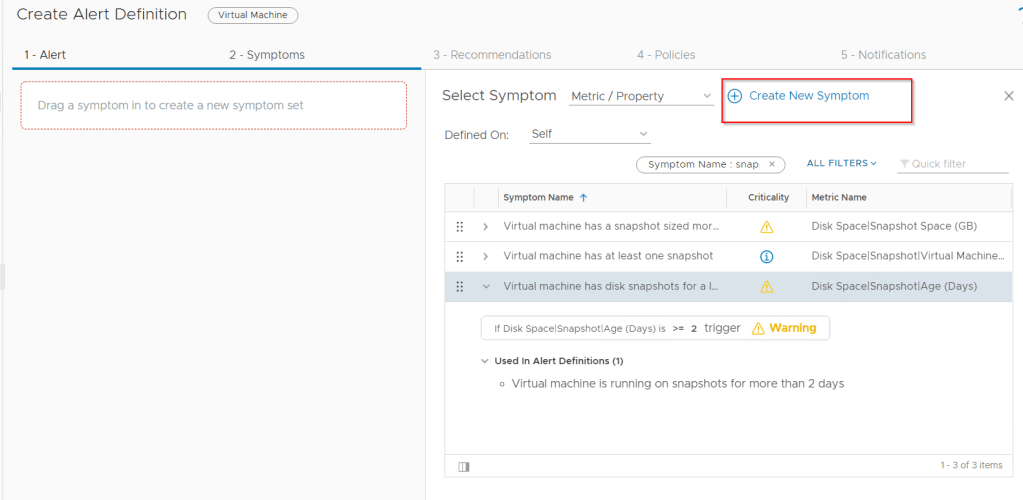
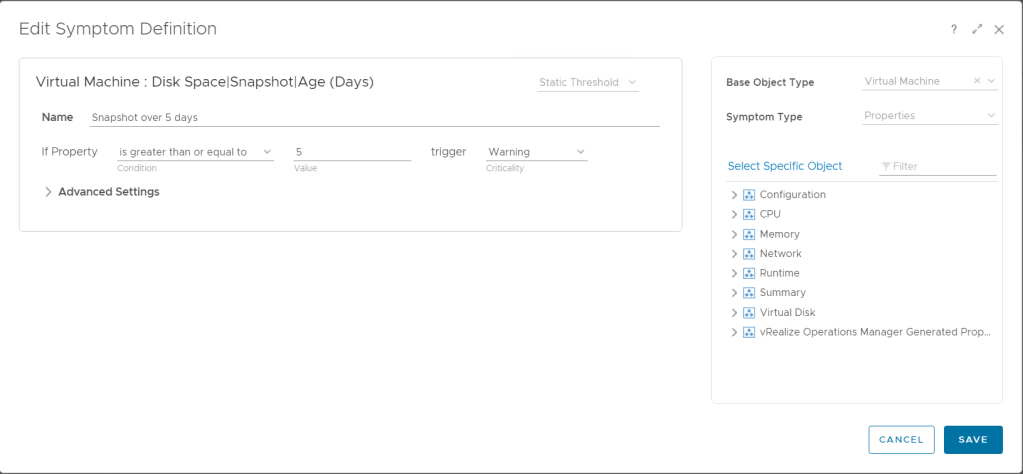
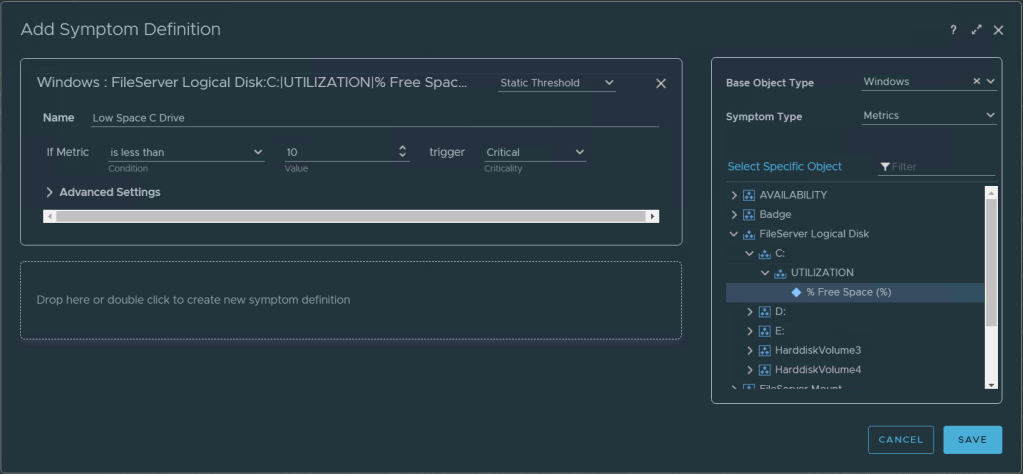
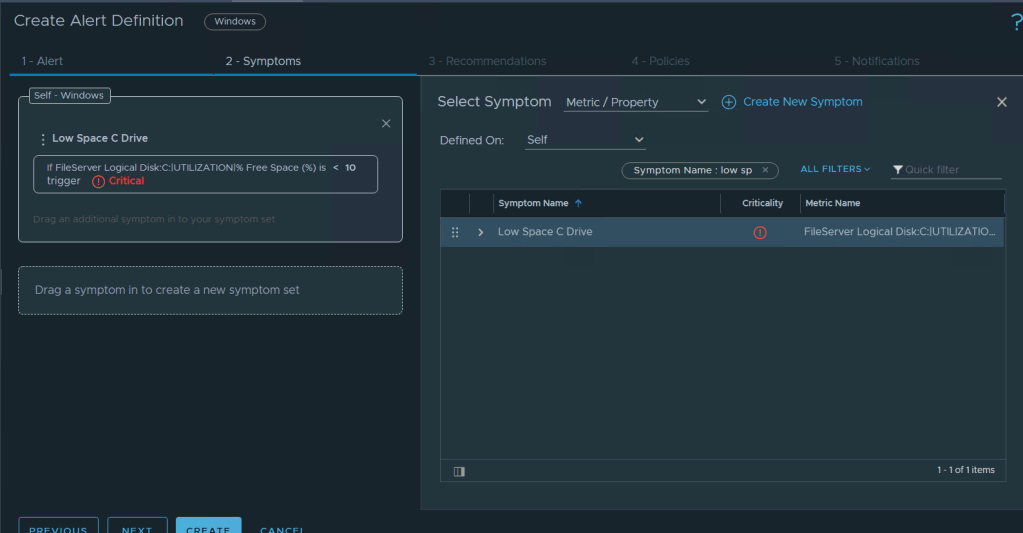
First we will need to create a symptom definition. Go to symptom definitions and click add.
Select the metric that will be used and give the symptom a name and set the threshold.
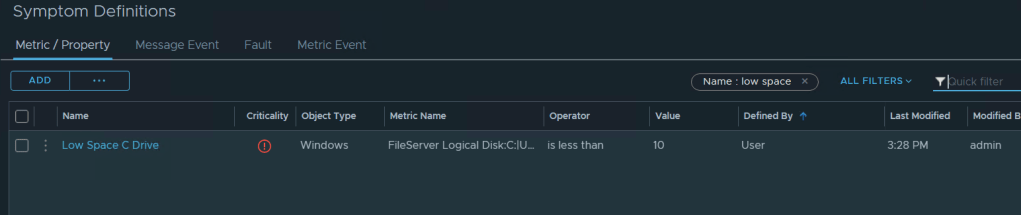
We can search to for the symptom to confirm it exist.
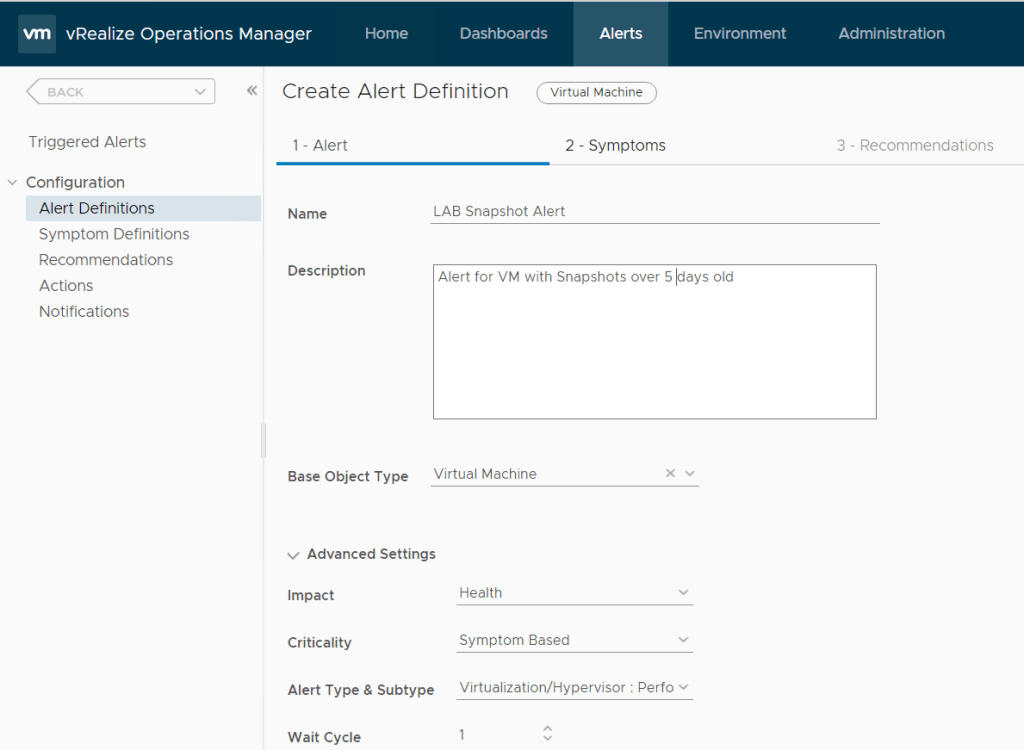
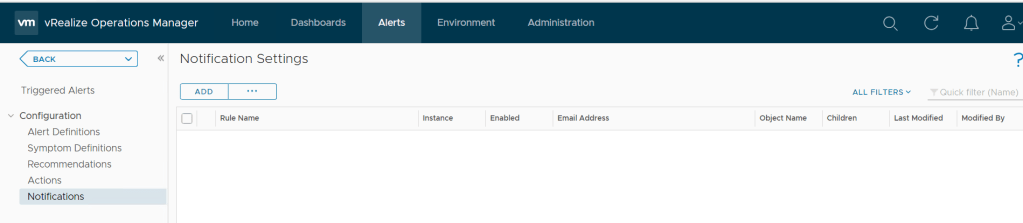
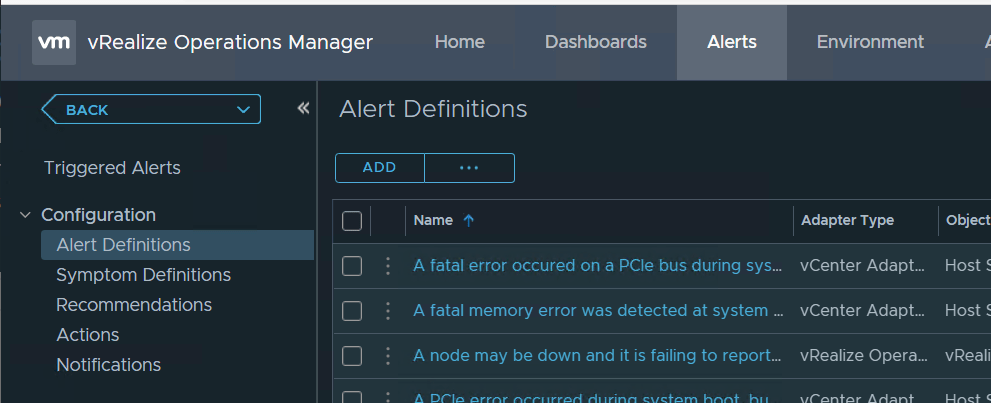
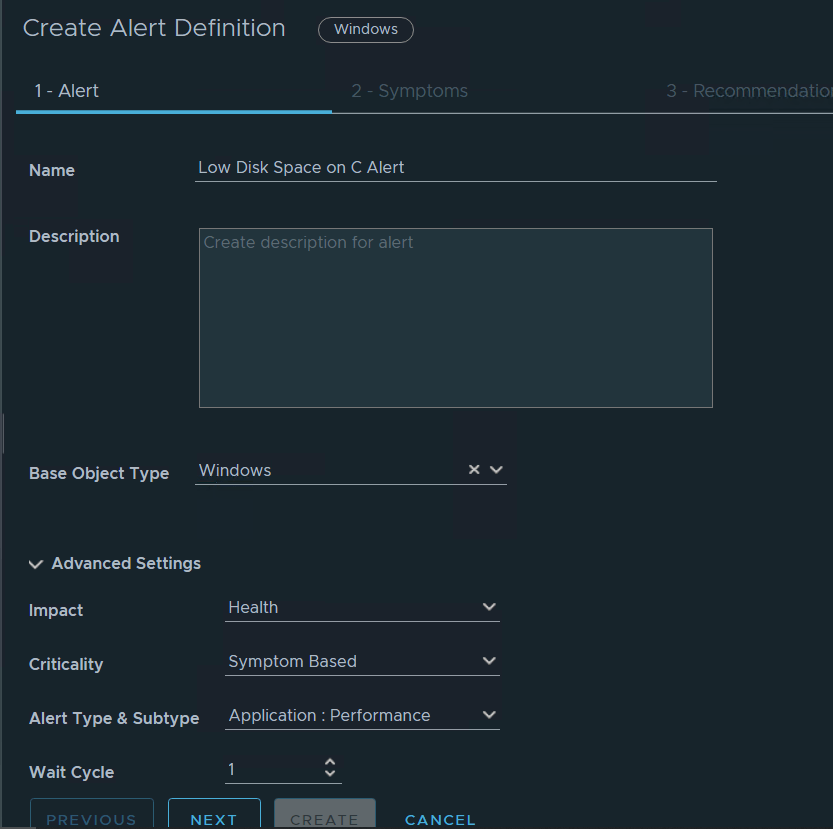
Next we need to create the alert. Go to alert definitions and click add.
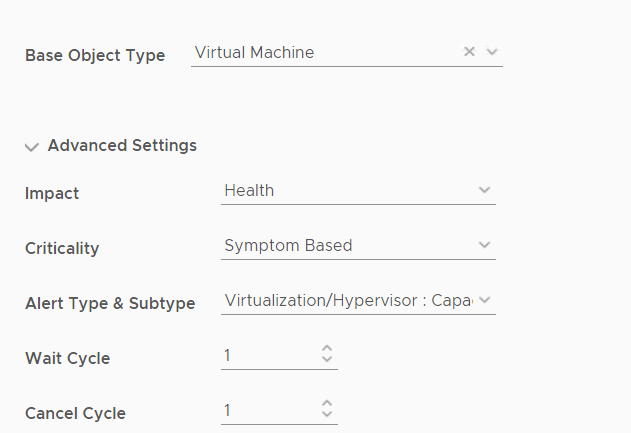
Give the Alert a name and select Windows as the base object type.
Next we need to add the symptom we created.
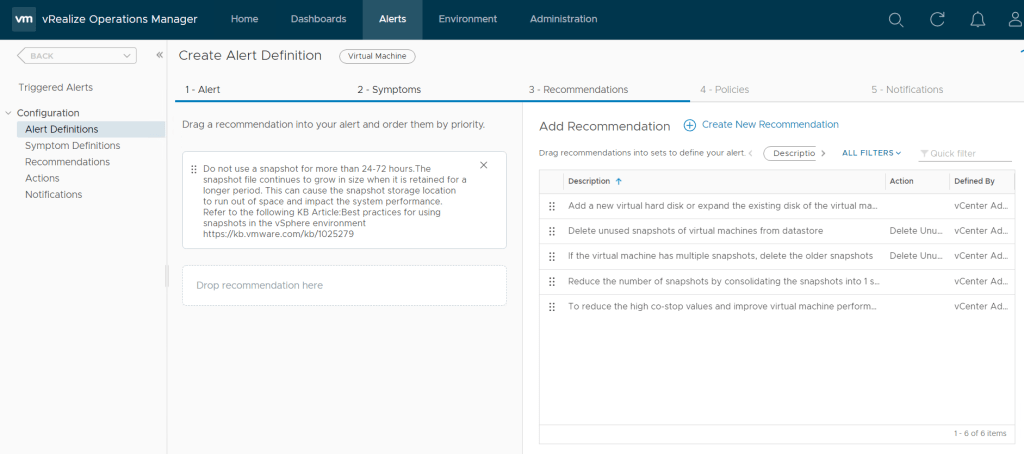
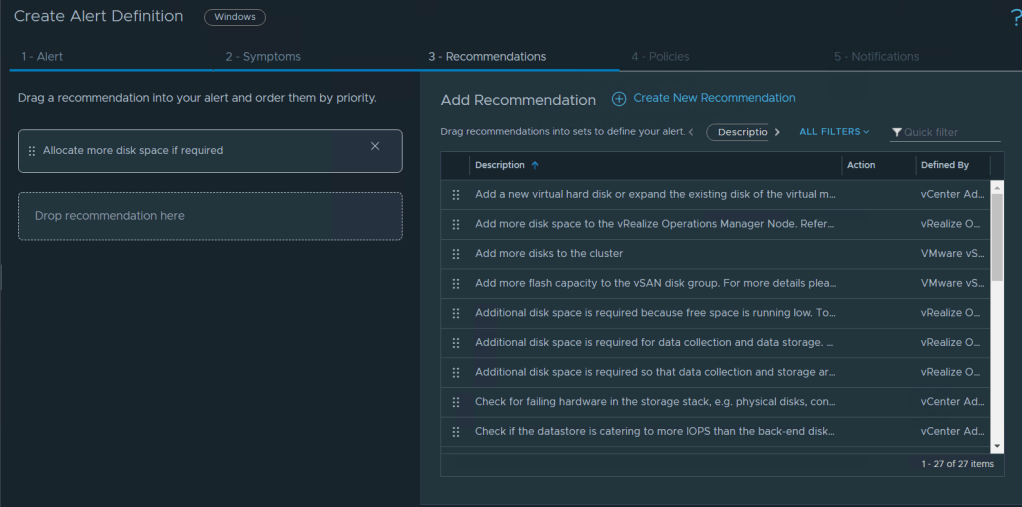
Add a recommendation if any are applicable or create a recommendation (this is not required but can be usefully)
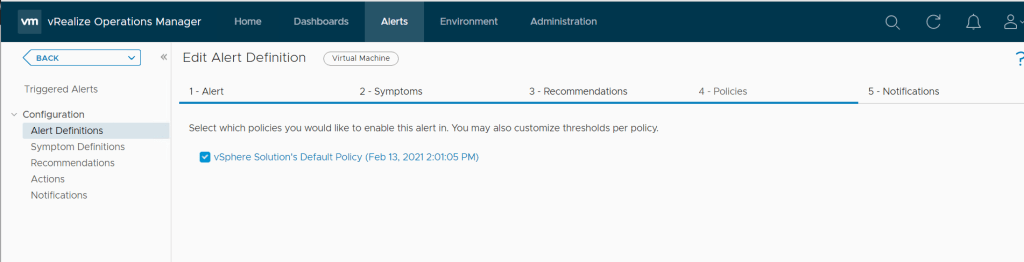
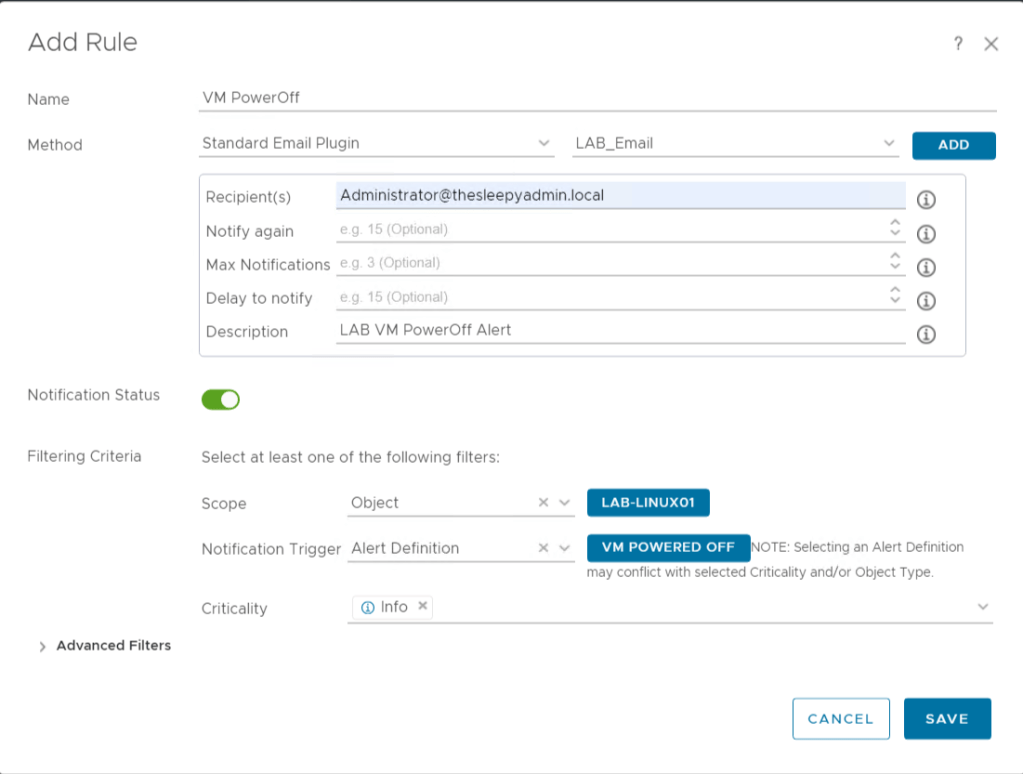
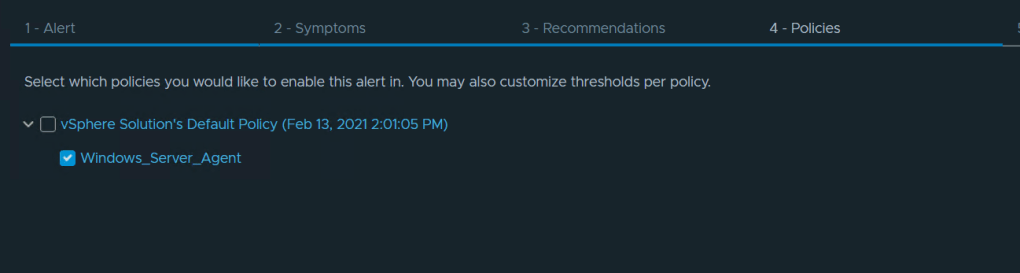
We need to add to a policy in this case it’s the Windows_Server_Agent and create a notification if this is required.
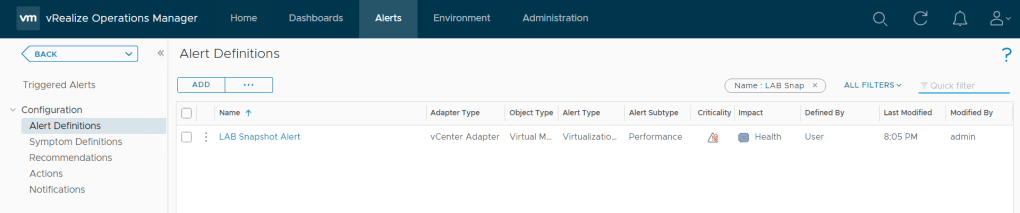
We can search for the alert to confirm it has been created and to view the details.
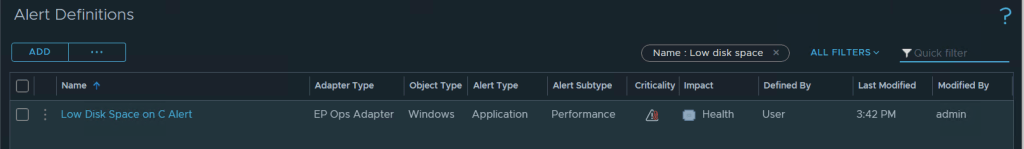
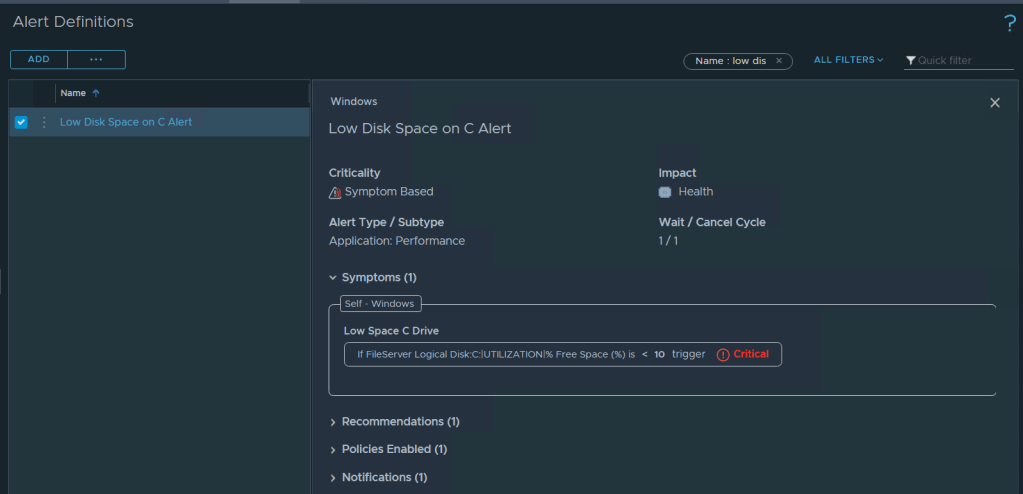
Now when the server goes below 10% free disk space the server will alert.
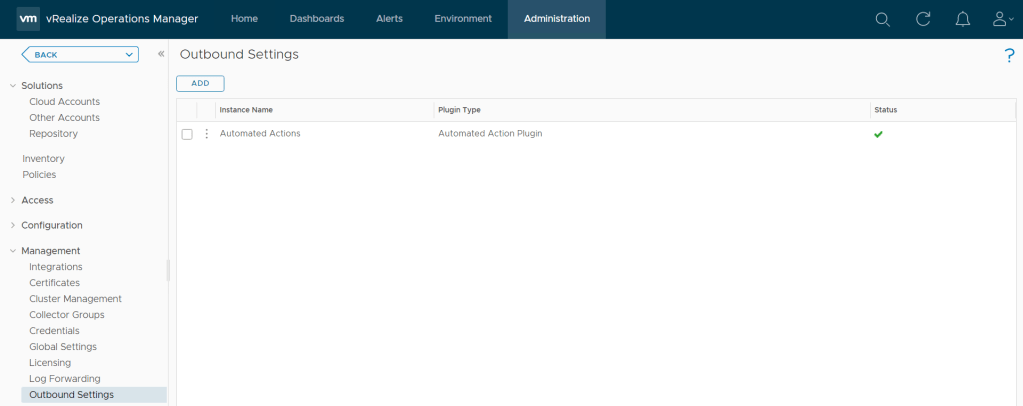
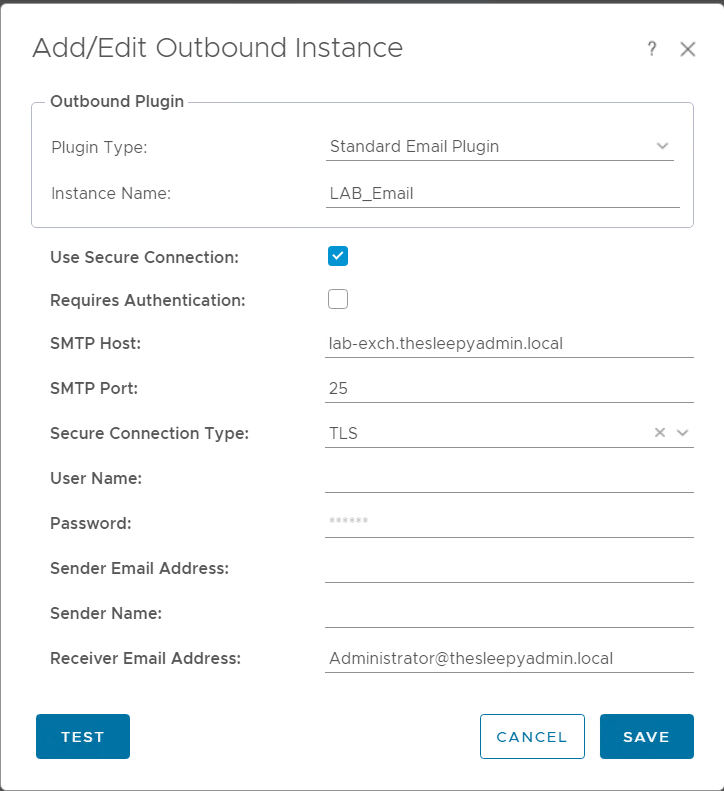
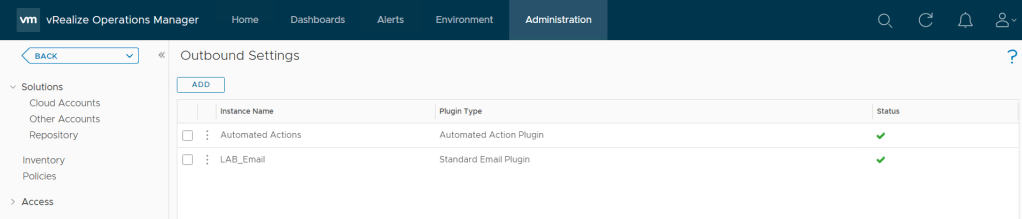
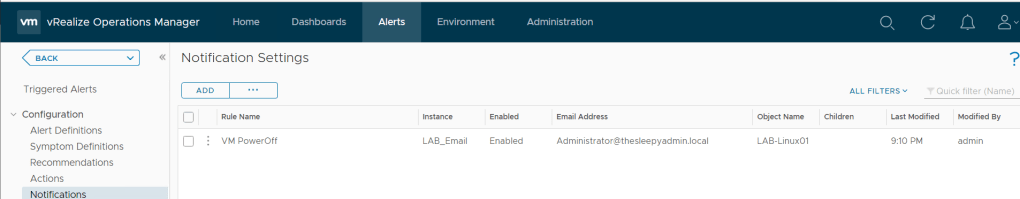
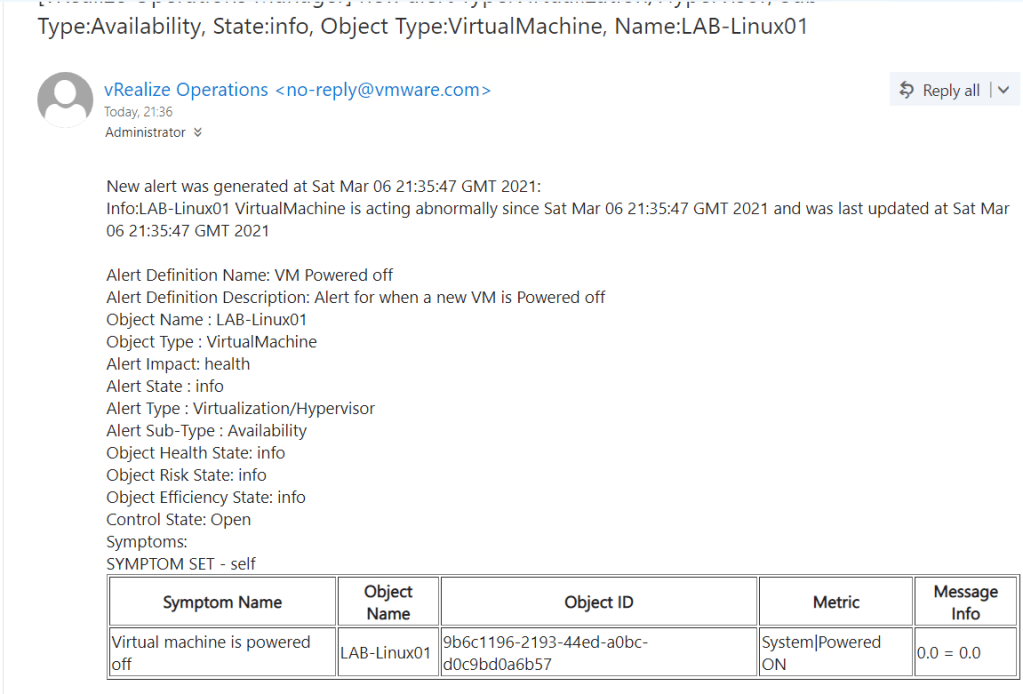
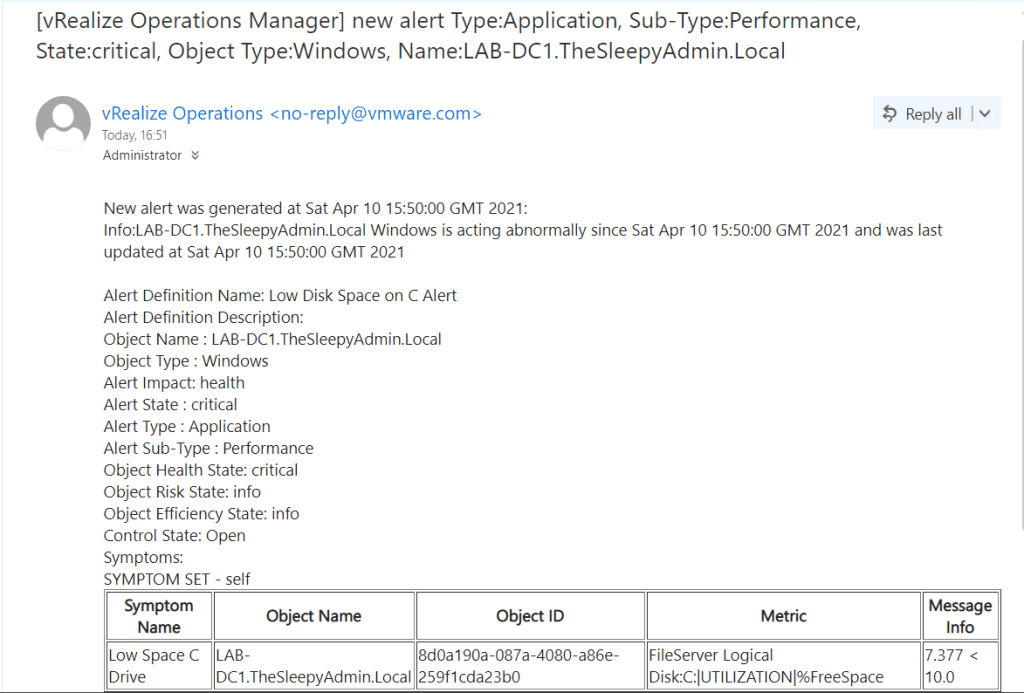
Below is what the email notification will look like, we have configured email notification in a previous post so we wont go back over it here.
There are many metrics and alerts that can be configure this is just an example of one type. We can also create multiple alerts so that we get warning alerts at maybe 20% before getting a critical alert.