In this post we will be going through the process of setting up Cloud Kerberos Trust to allow Entra Joined devices to access on prem resources (FileShare, Web apps..).
Prerequisites
Before starting, ensure you have the following:
- Microsoft Entra ID Tenant
- Active Directory
- Domain Admin and Global Admin rights
- Intune license and admins rights to configure Windows Hello for Business settings.
- Windows 10 or Windows 11 devices
I used this learn article to setup the cloud Kerberos trust.
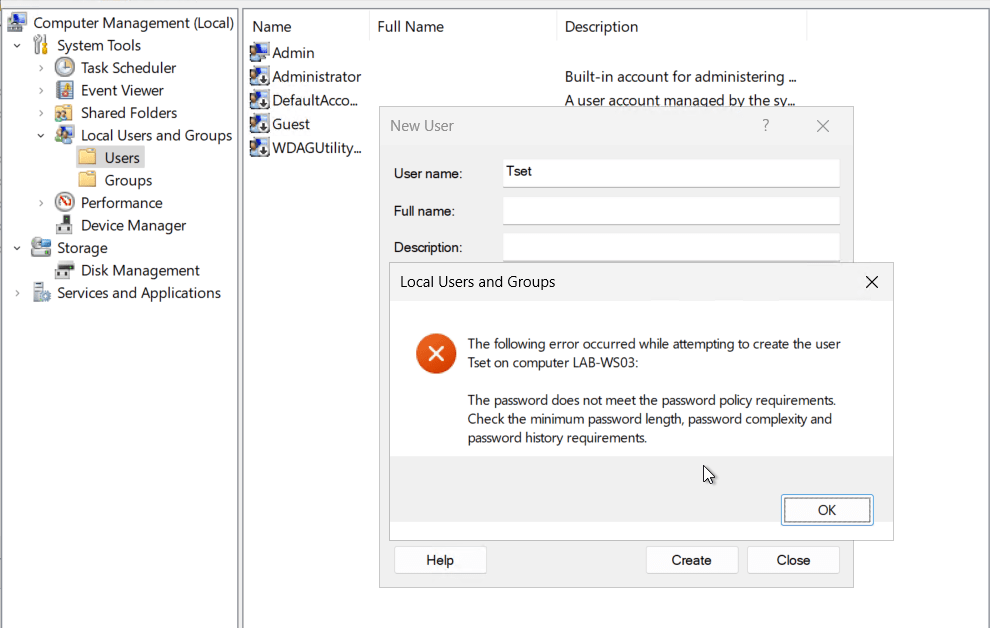
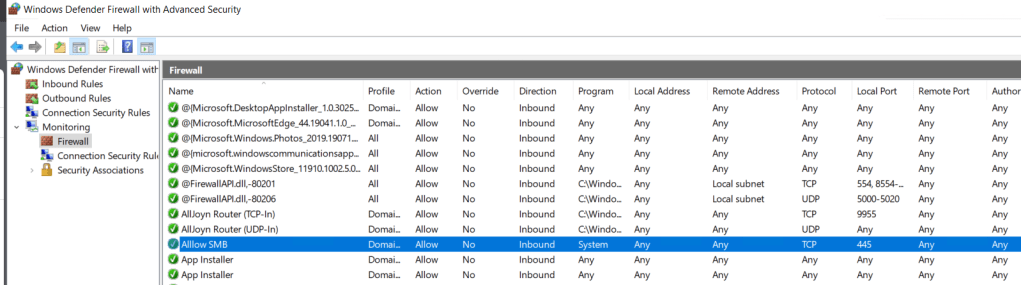
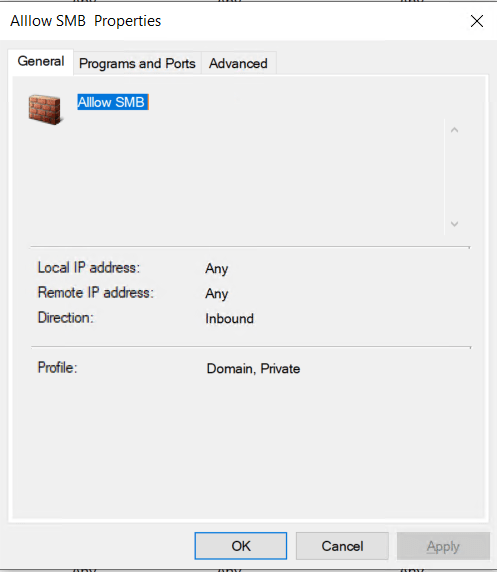
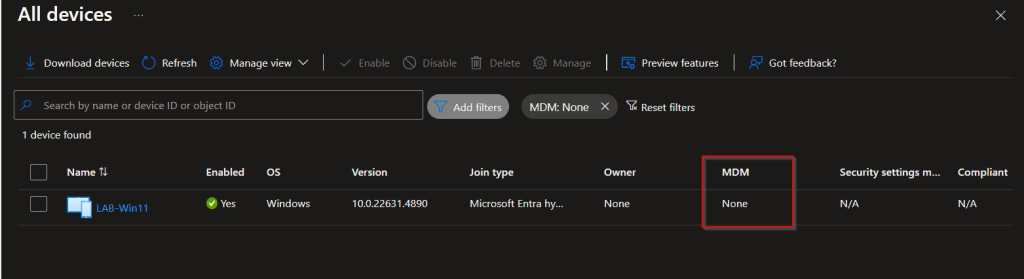
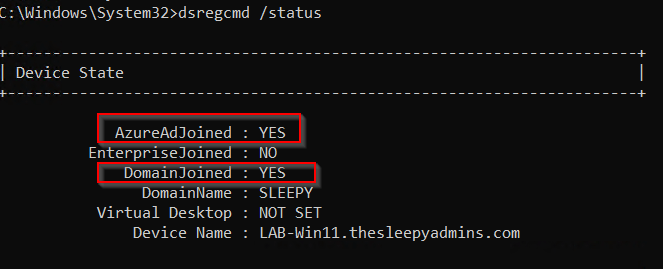
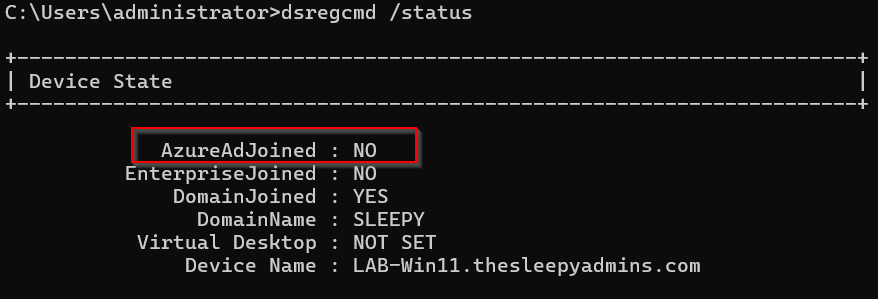
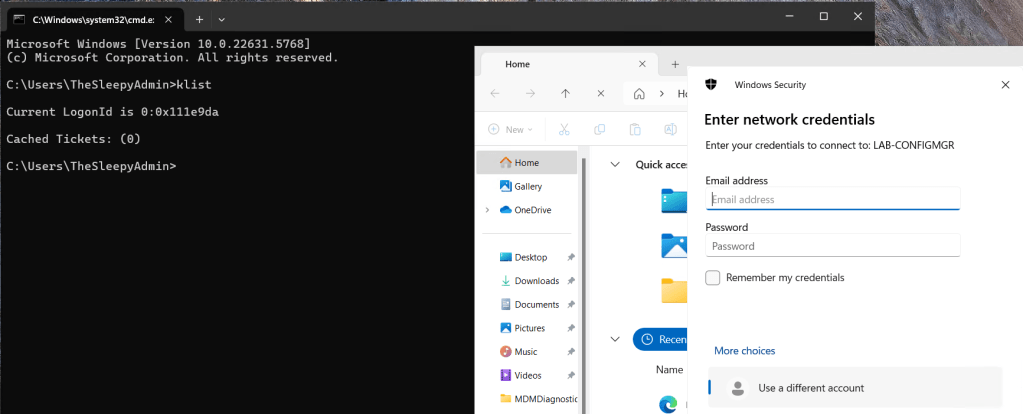
Currently when I try to access resource using a Entra only joined device I get prompted for my username and password by on-prem resources. This is due to NTLM being blocked and not being issue Kerberos tickets due to being a Entra Only joined device.
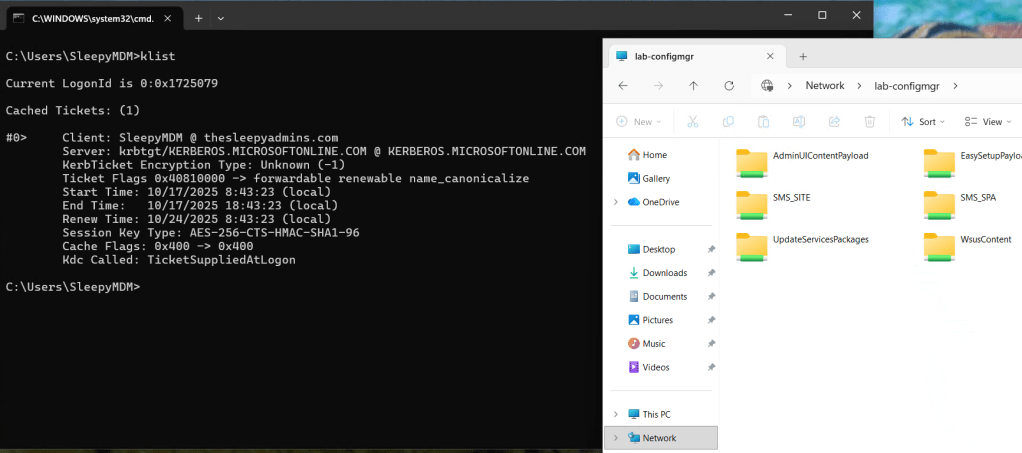
We can run klist to see if any Kerberos tickets have issues.
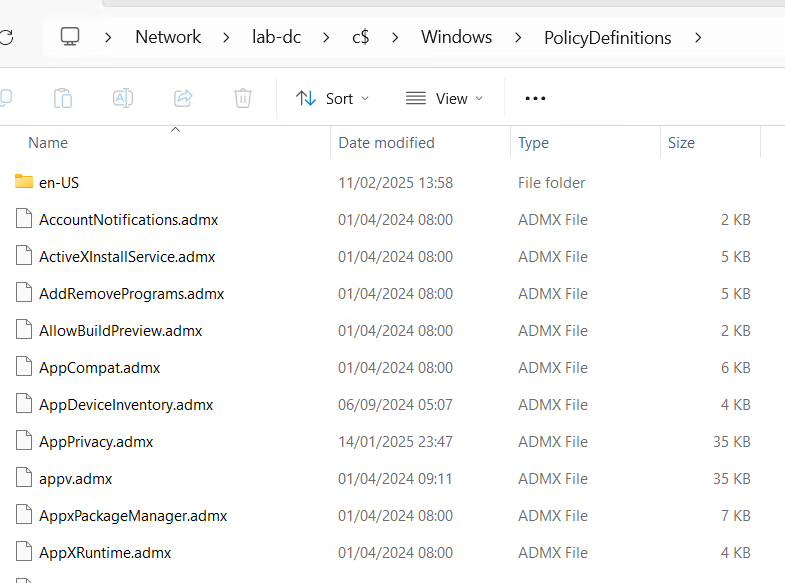
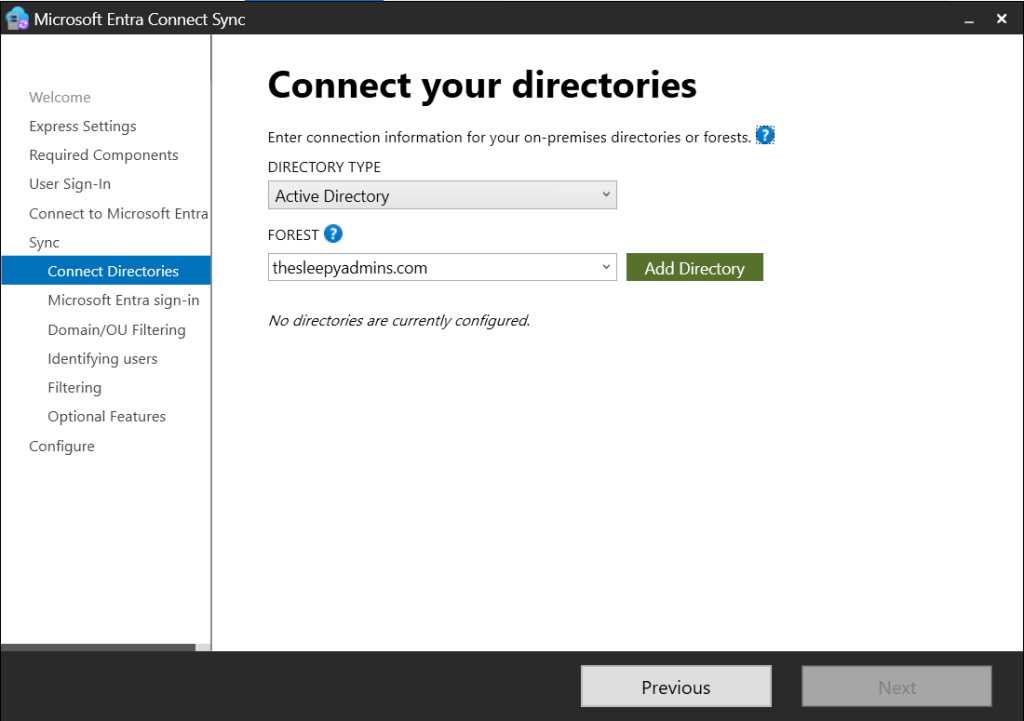
First we need to setup the AD object that will be used by Entra to generate Kerberos TGTs.
Open a PowerShell prompt using the Run as administrator option. Install the Azure AD Kerberos PowerShell module by running:
# First, ensure TLS 1.2 for PowerShell gallery access.
[Net.ServicePointManager]::SecurityProtocol = [Net.ServicePointManager]::SecurityProtocol -bor [Net.SecurityProtocolType]::Tls12

# Install the AzureADHybridAuthenticationManagement PowerShell module.
Install-Module -Name AzureADHybridAuthenticationManagement -AllowClobber
Run the following PowerShell commands to enable cloud trust Kerberos.
# Specify the on-premises Active Directory domain. A new Microsoft Entra ID
# Kerberos Server object will be created in this Active Directory domain.
$domain = $env:USERDNSDOMAIN

# Enter an Azure Active Directory Hybrid Identity Administrator username and password.
$cloudCred = Get-Credential -Message 'An Active Directory user who is a member of the Hybrid Identity Administrators group for Microsoft Entra ID.'

# Create the new Microsoft Entra ID Kerberos Server object in Active Directory
# and then publish it to Azure Active Directory.
Set-AzureADKerberosServer -Domain $domain -CloudCredential $cloudCred
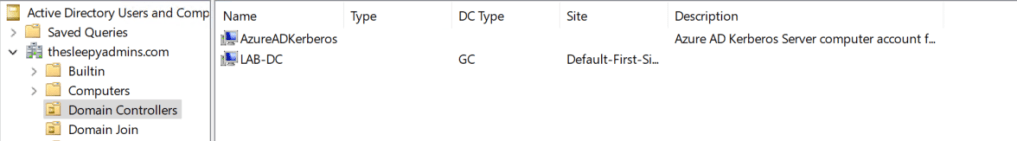
This will then create a object in AD similar to a read only domain controller.
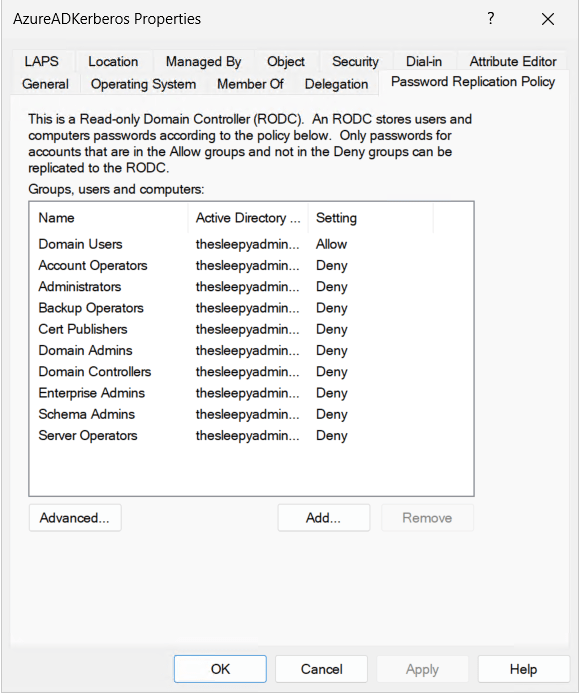
One thing to note is that if your account is part of a privileged group in AD, your password wont be replicated to this new object. We can check the group by going to the AD object and password replication tab. If your account is in any of the deny group you wont be issued Kerberos tickets.
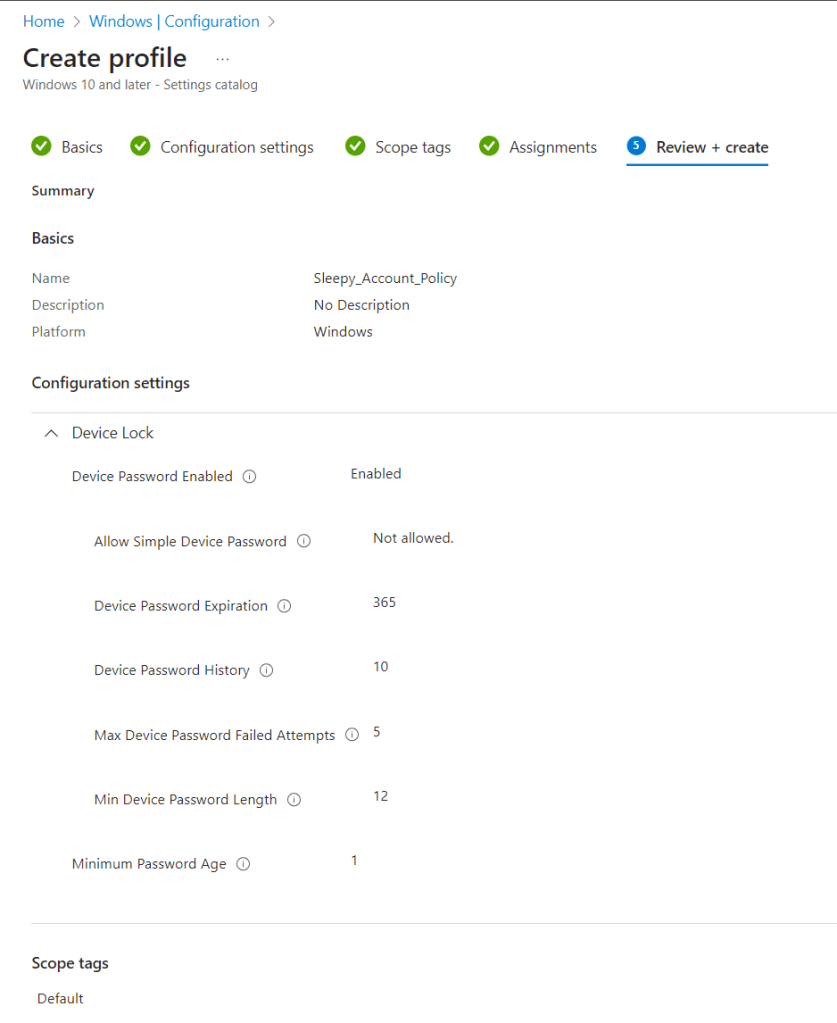
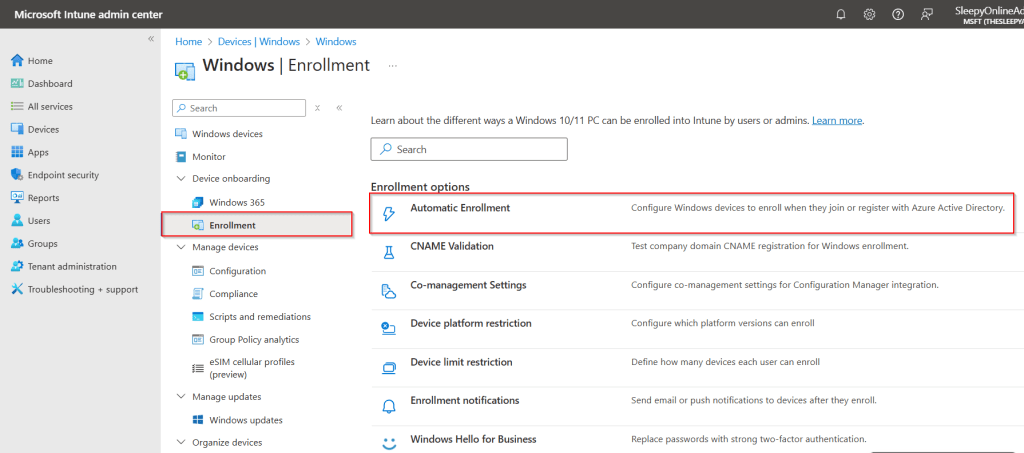
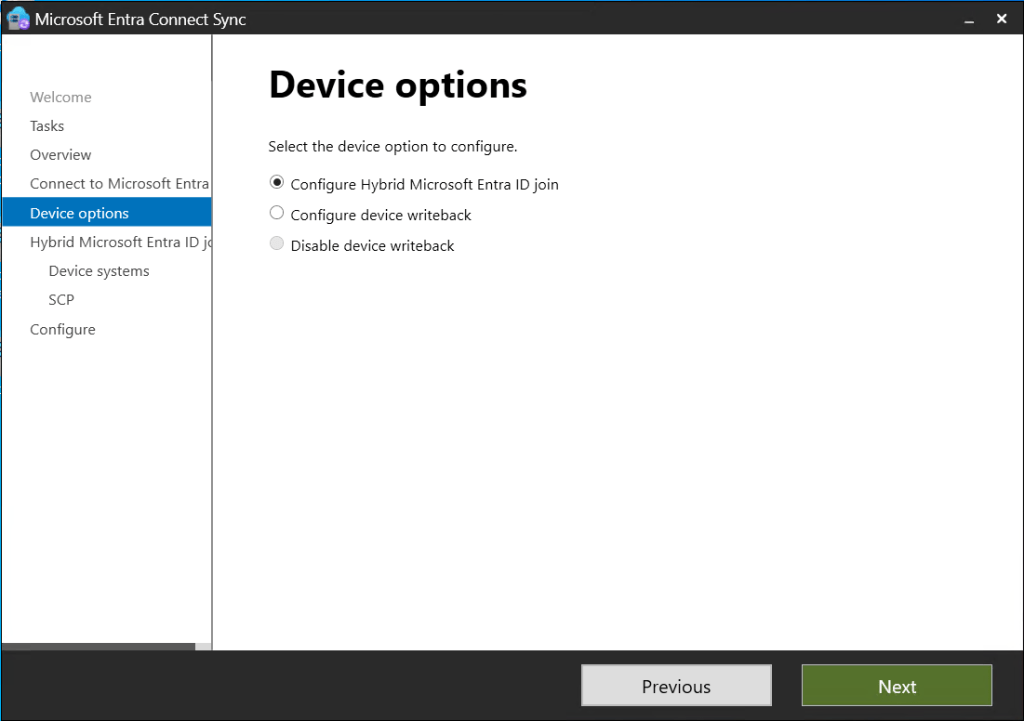
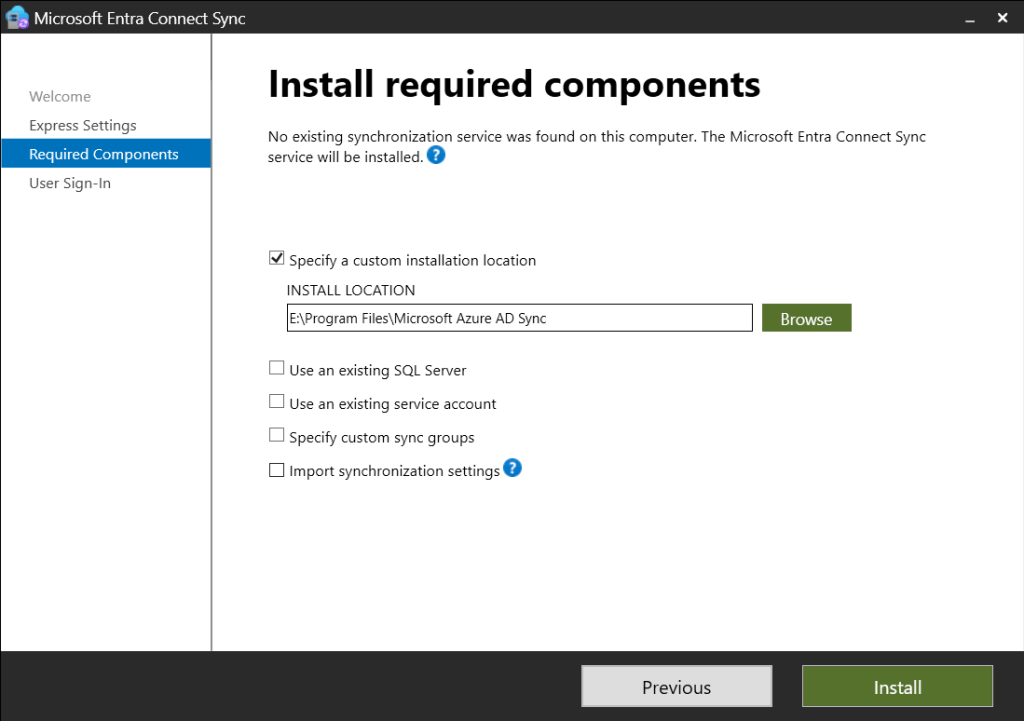
Next we need to go to Intune and Configure the Windows Hello for Business policy.
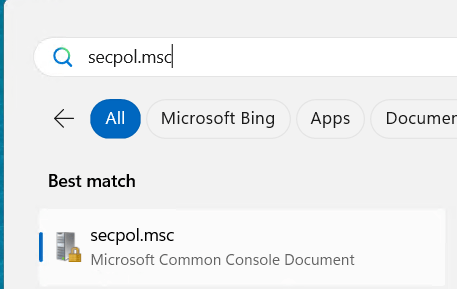
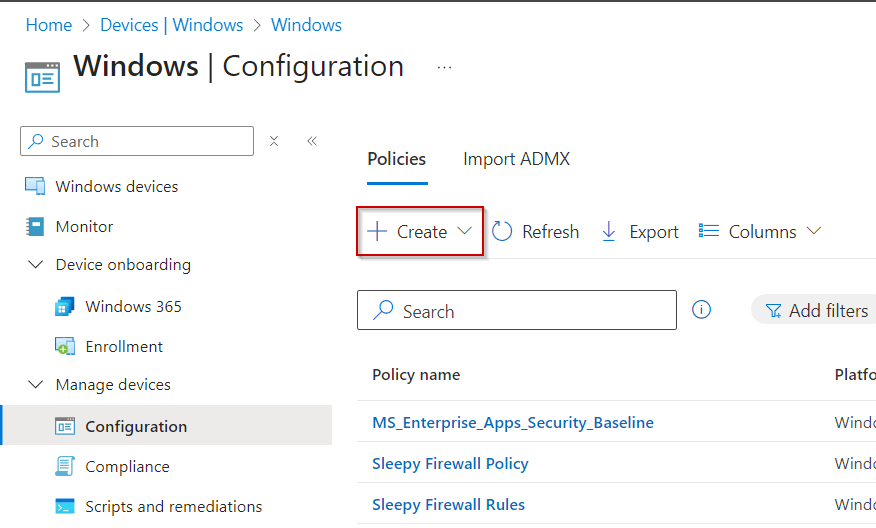
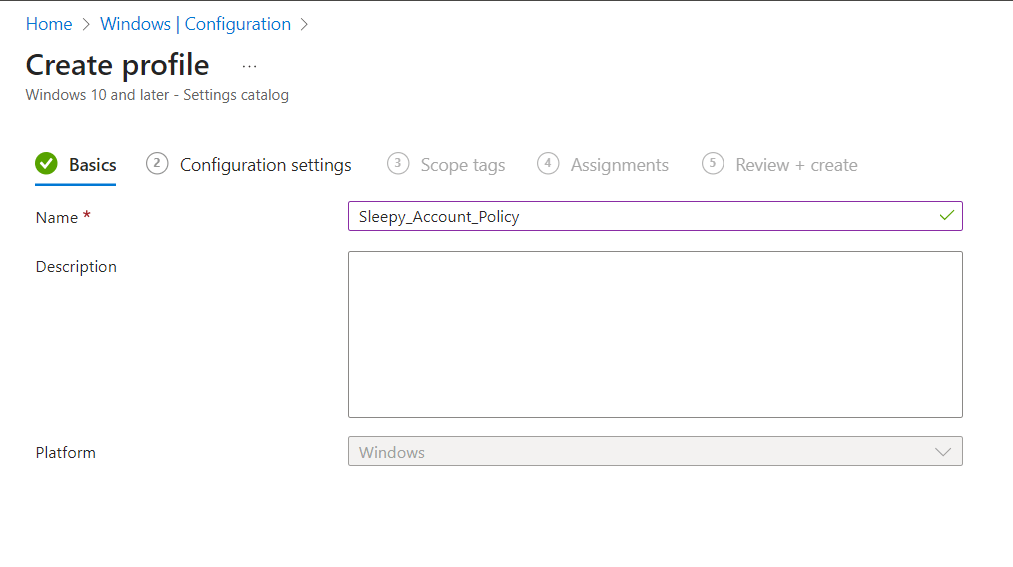
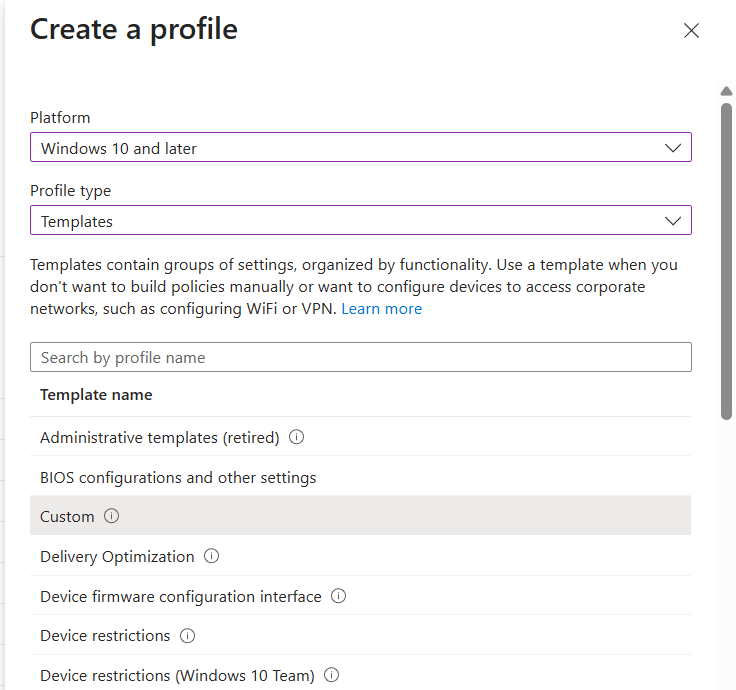
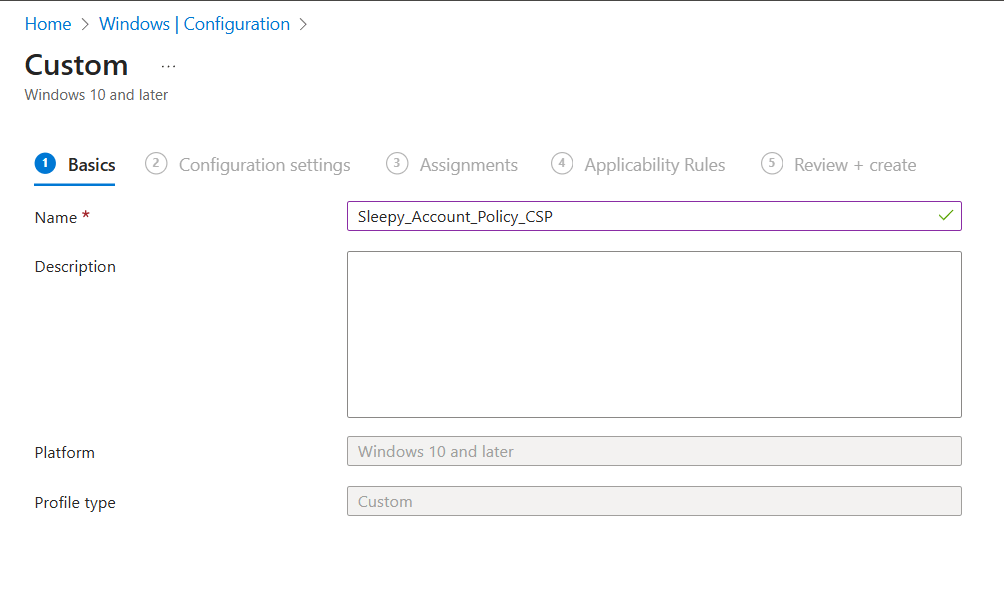
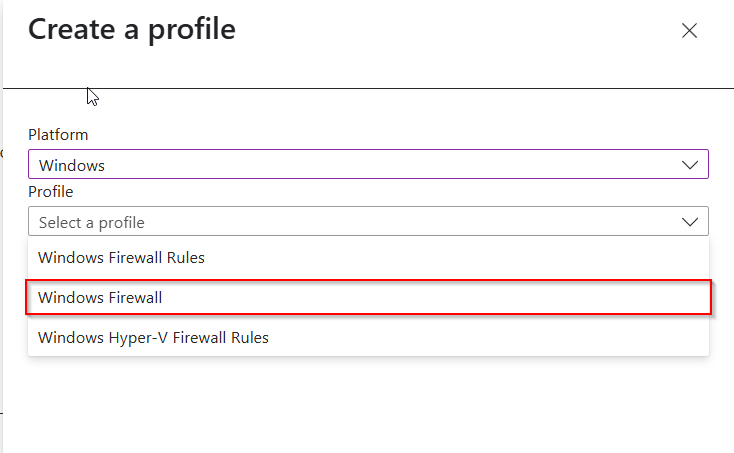
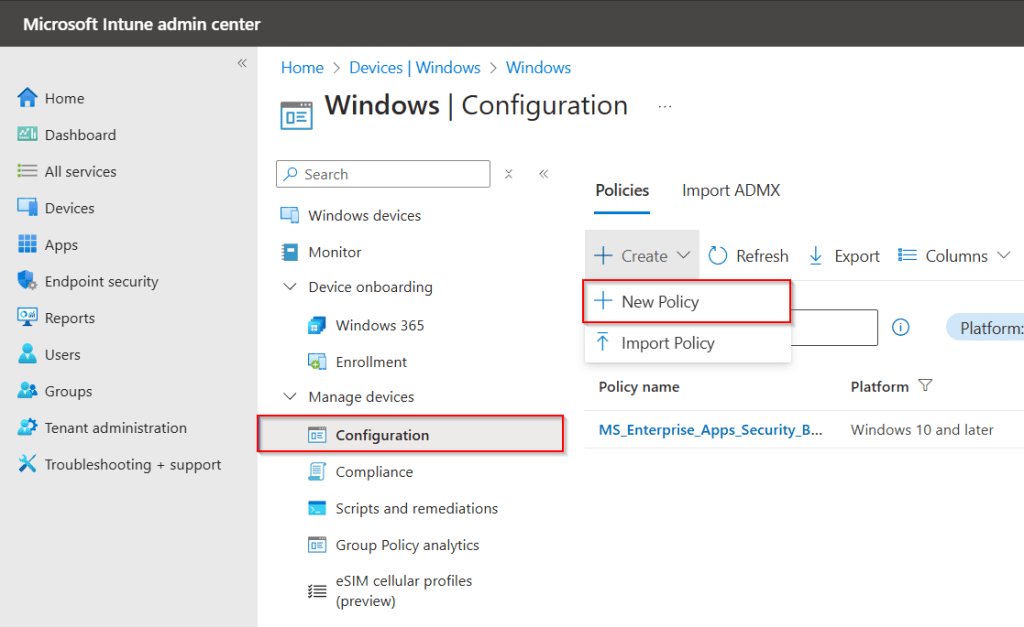
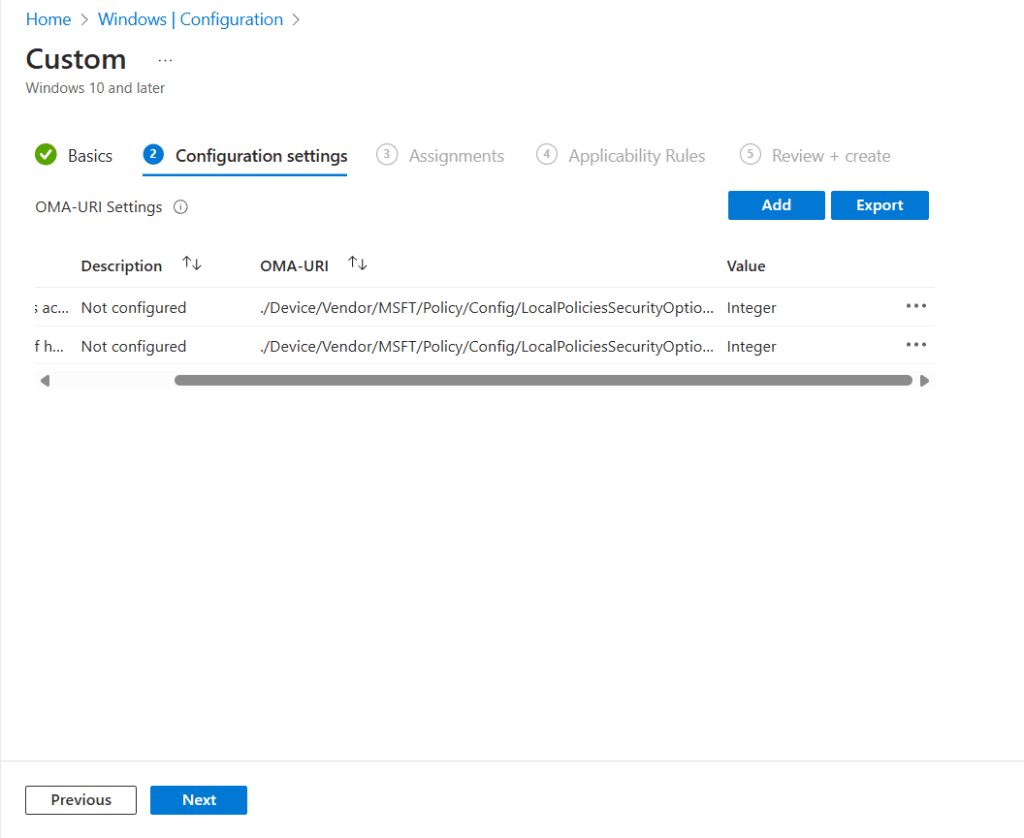
Logon to the Intune Admin portal > Devices > Windows > Configuration > Create New Policy.
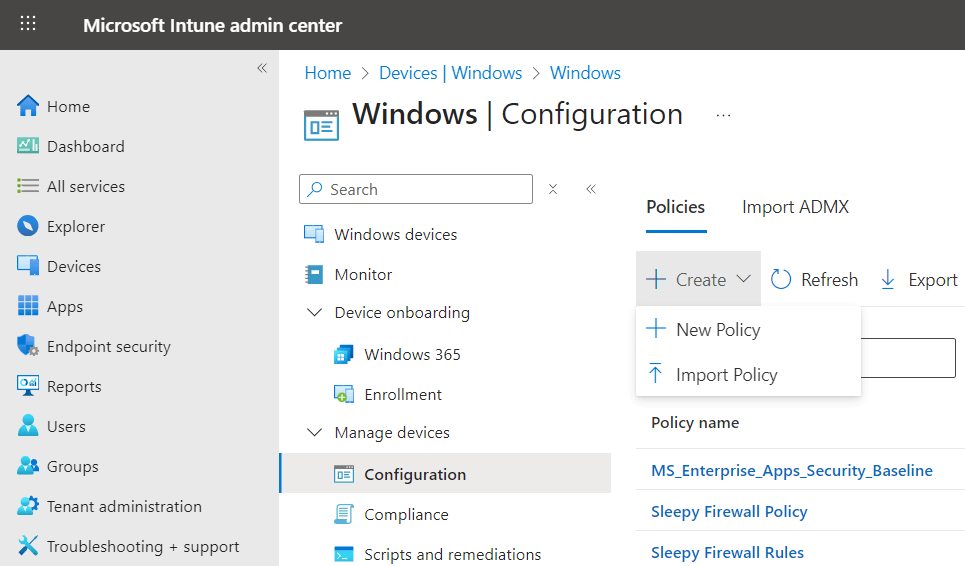
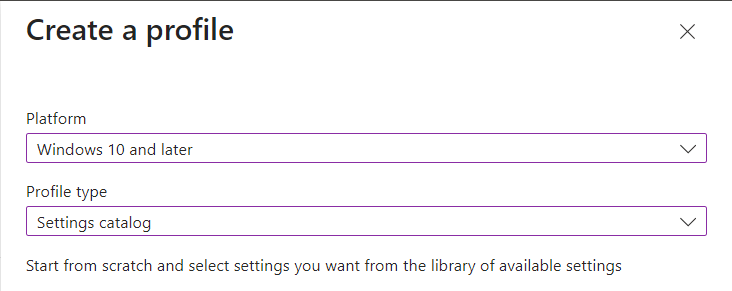
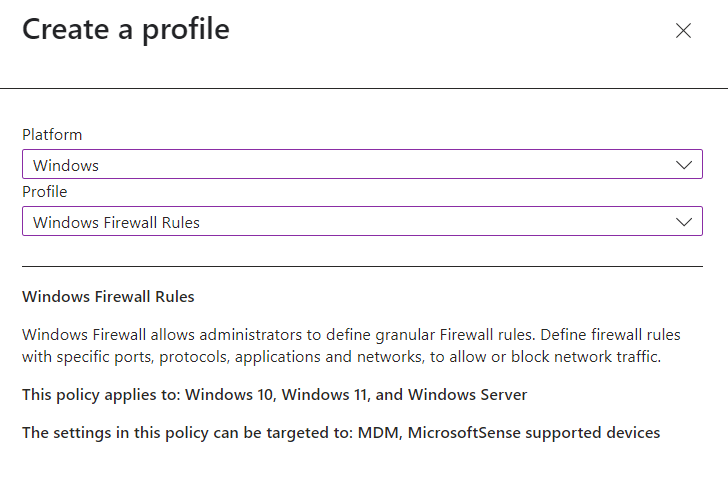
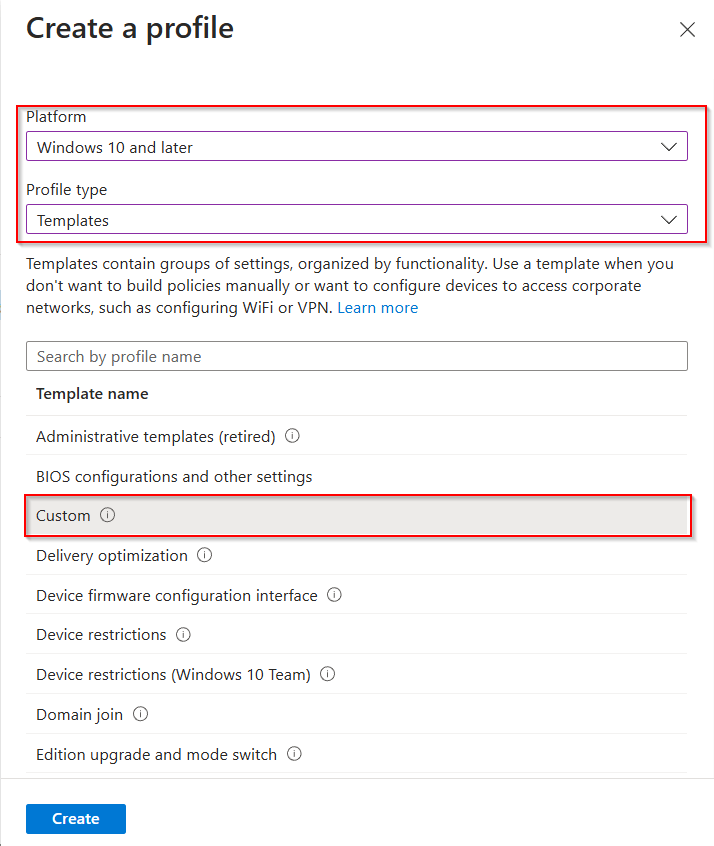
Select platform Windows 10 and Later and profile type Settings Catalog, click Create
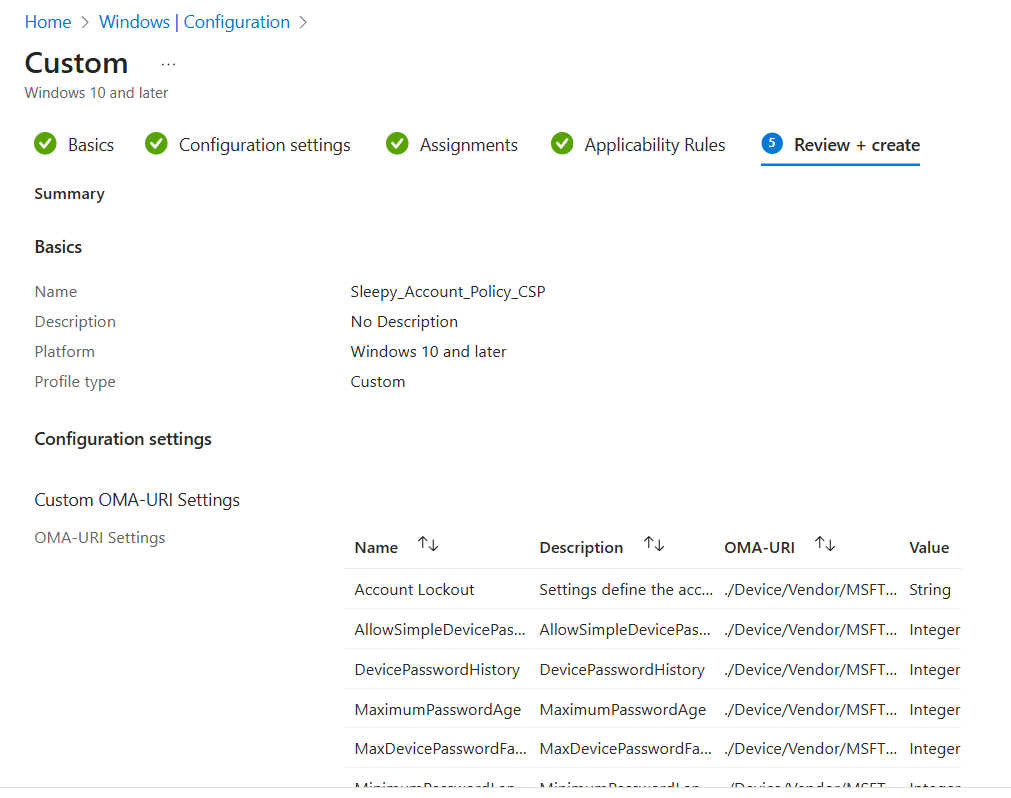
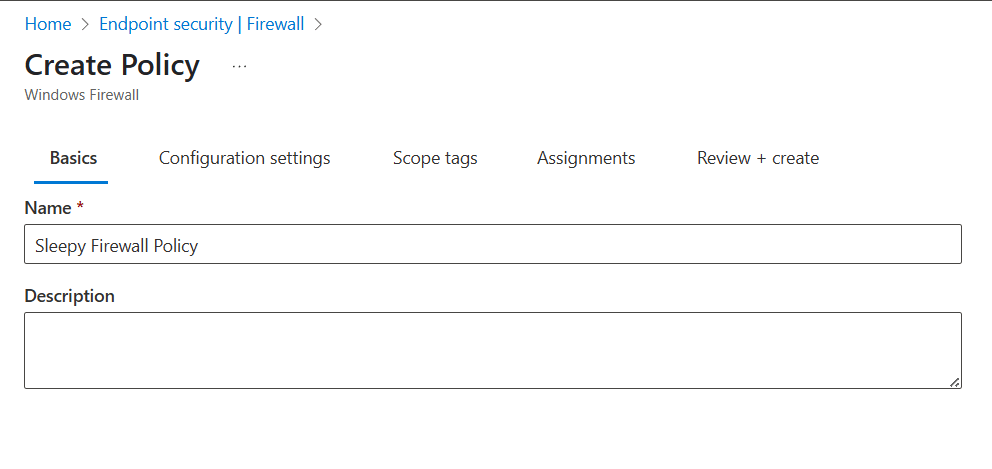
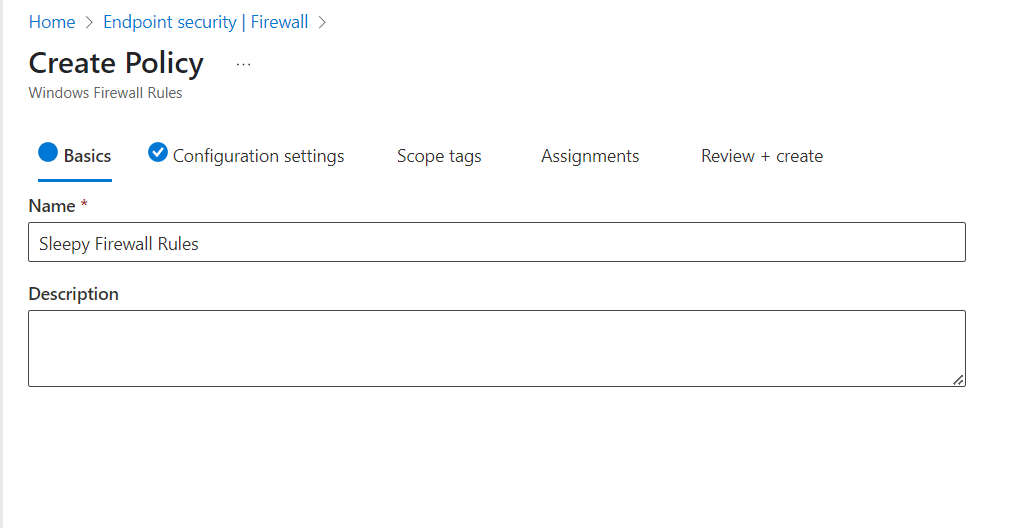
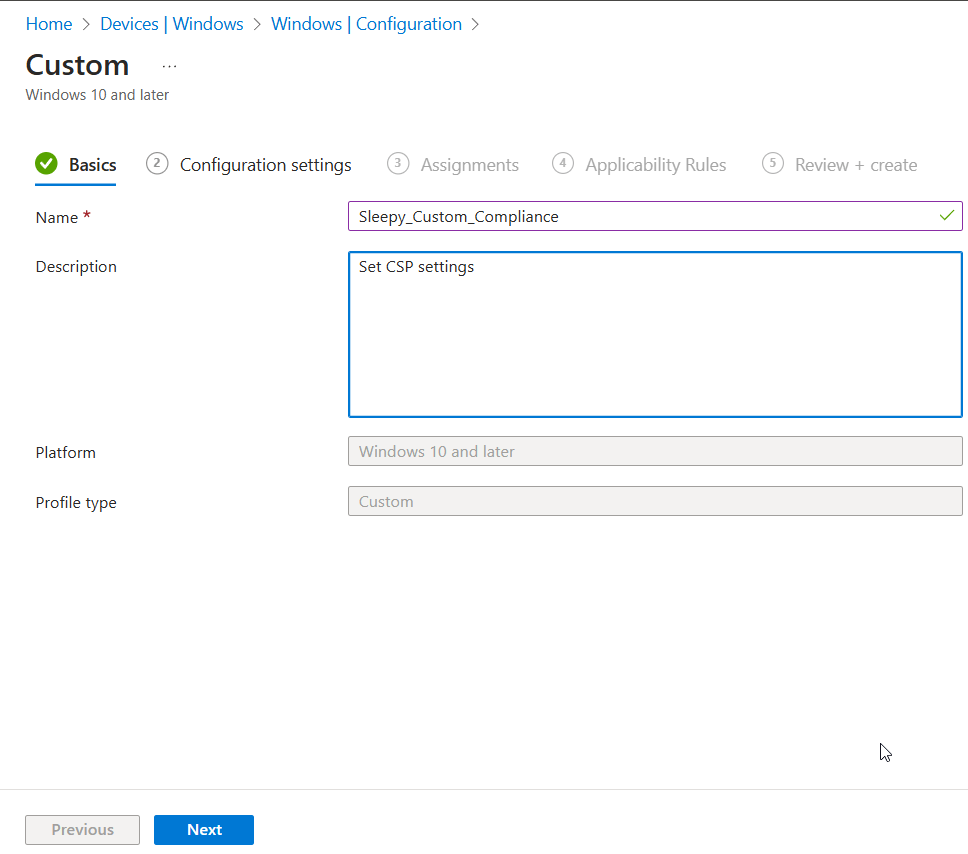
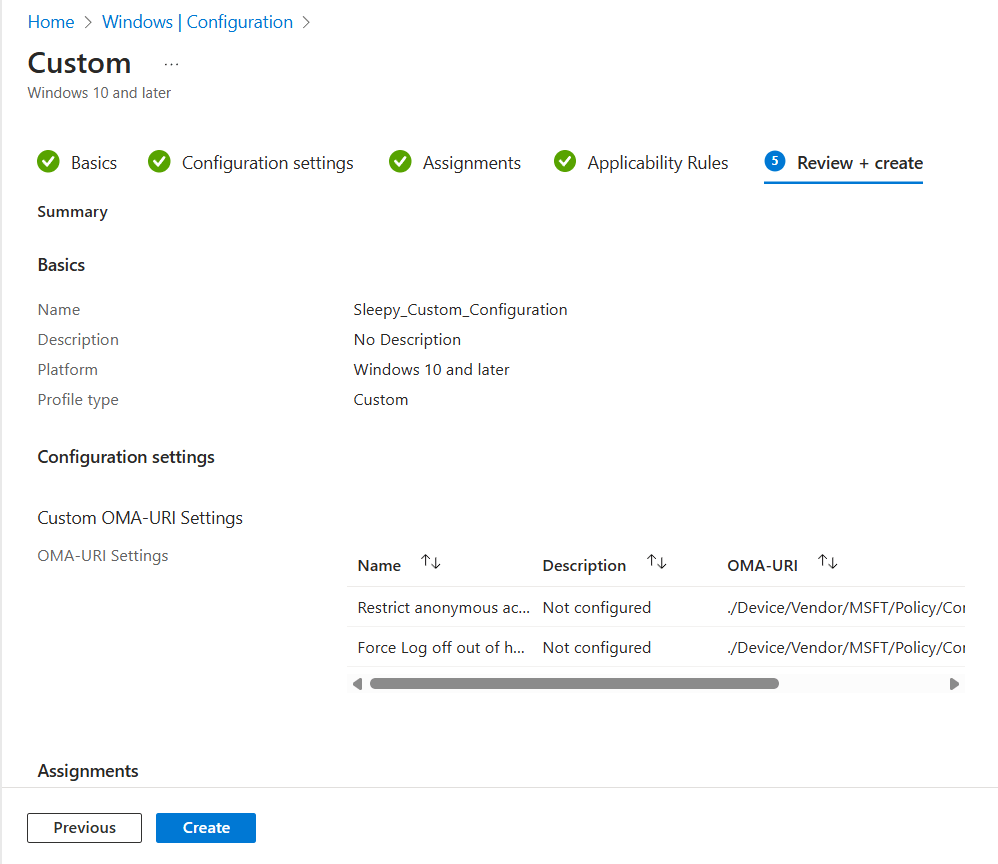
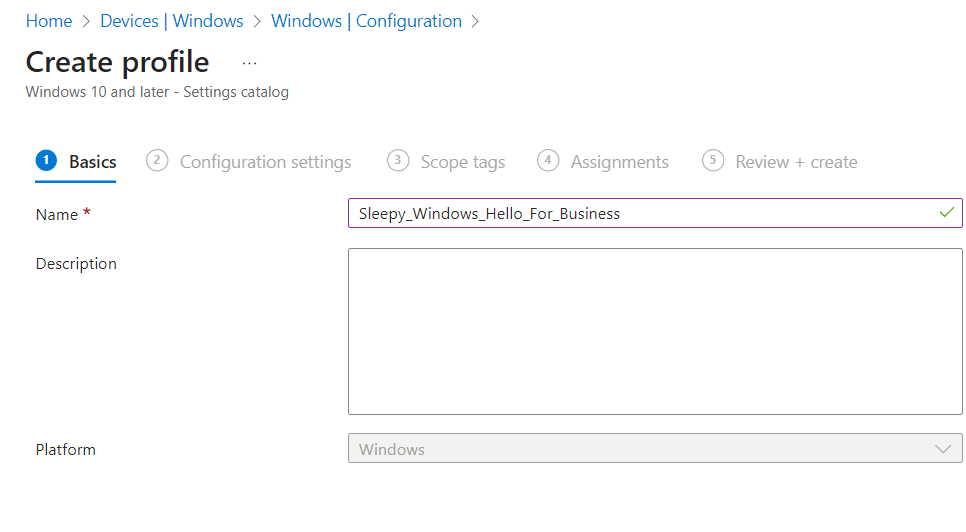
Give the policy a name and description.
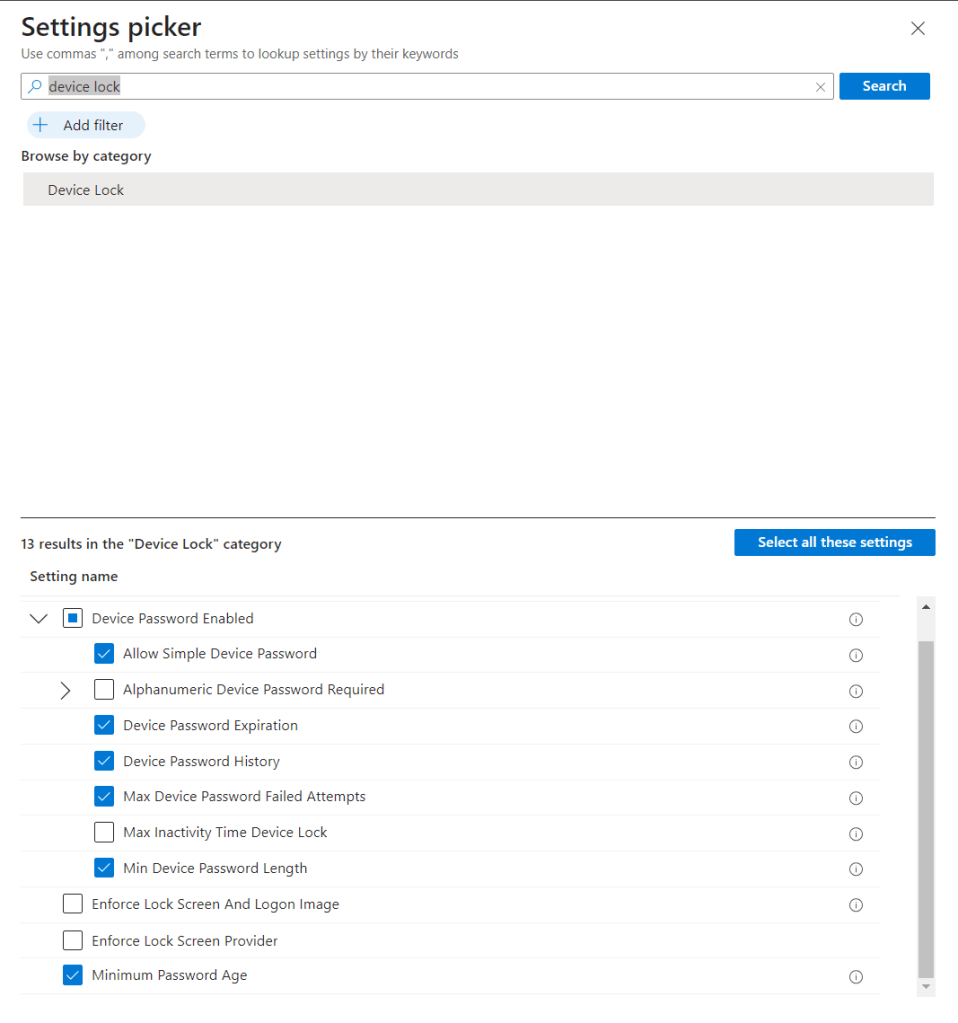
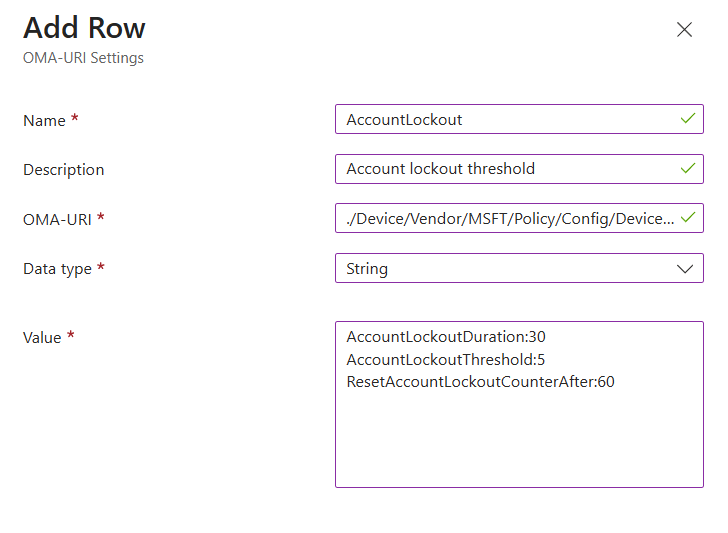
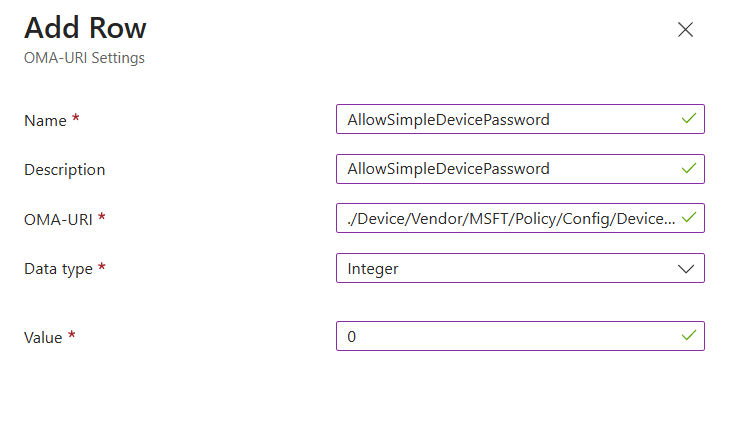
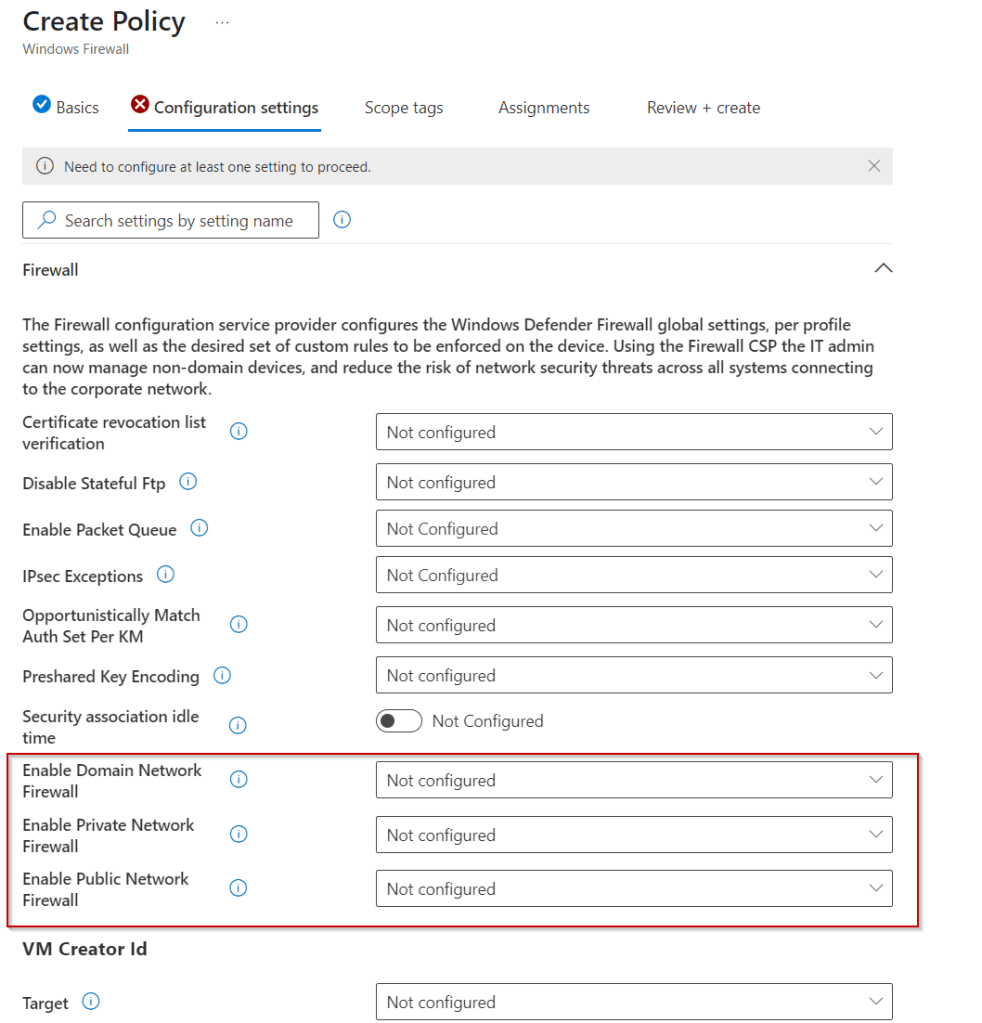
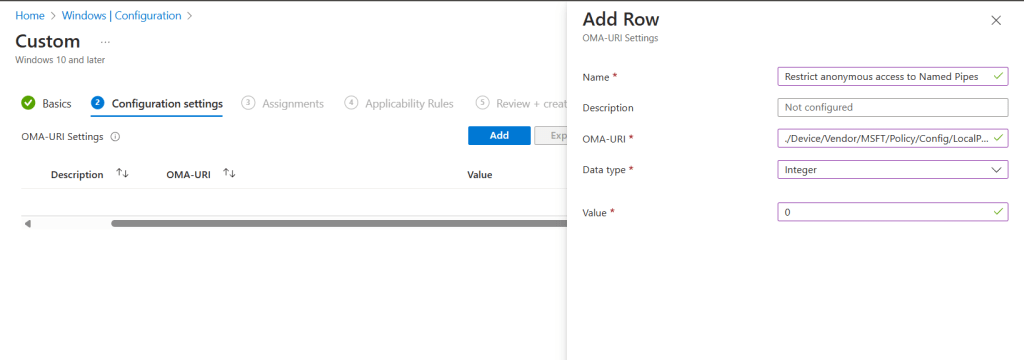
Click add settings and search for Windows Hello for Business.
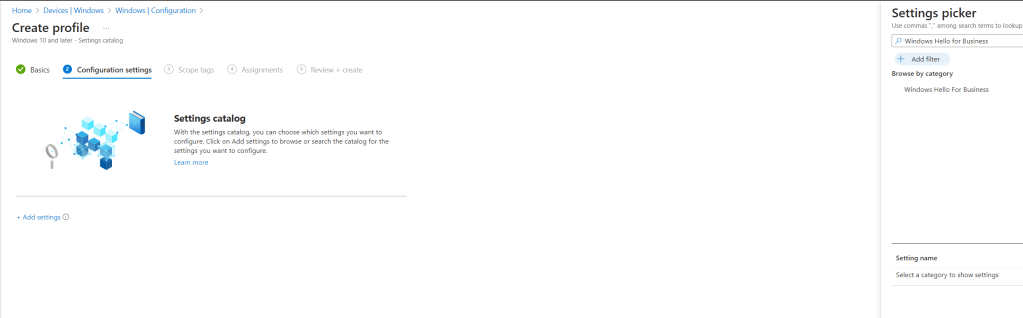
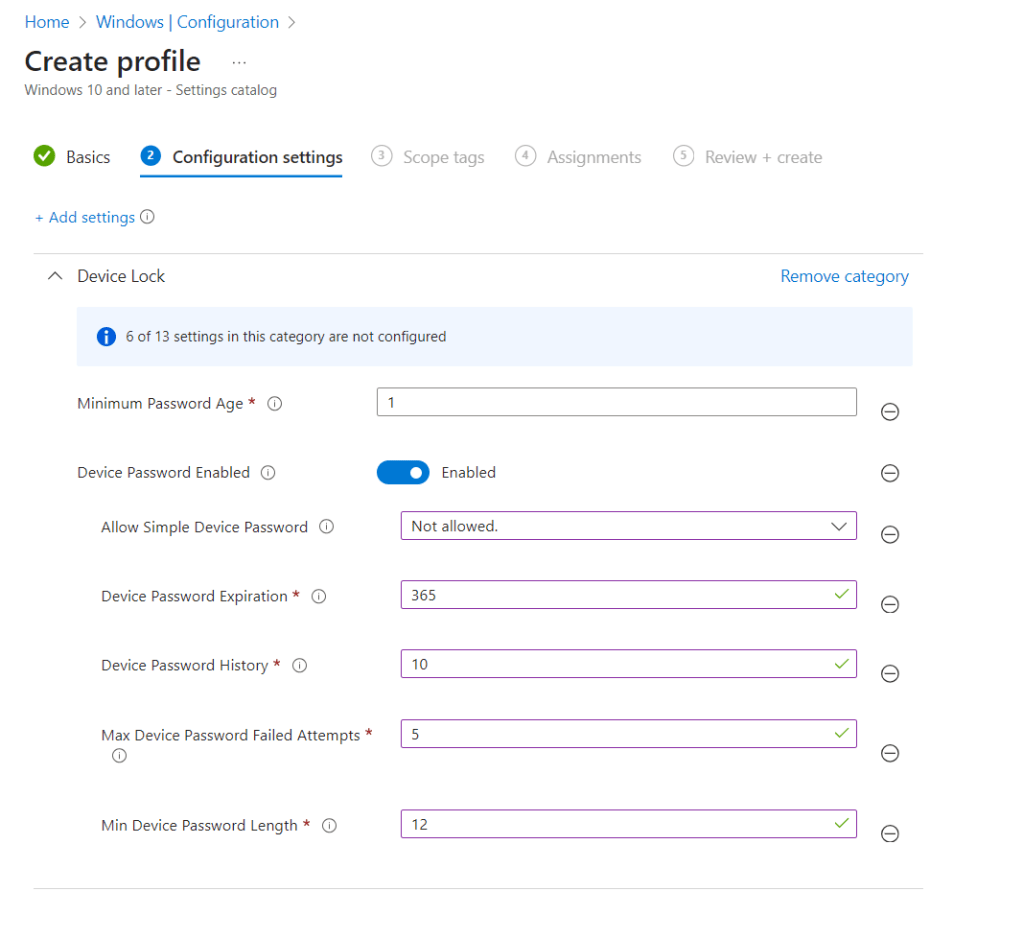
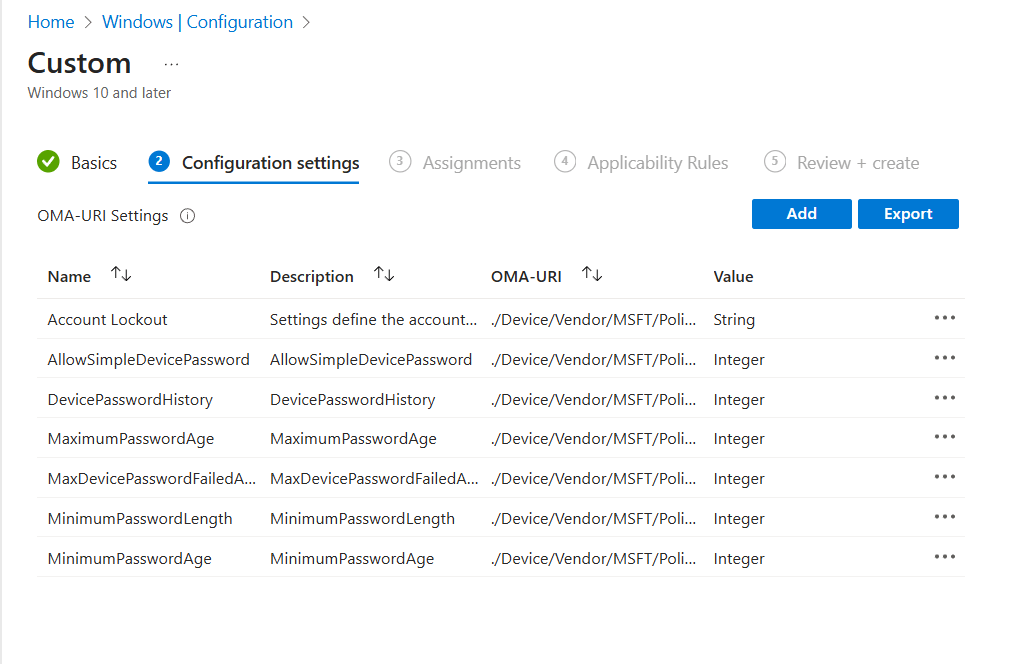
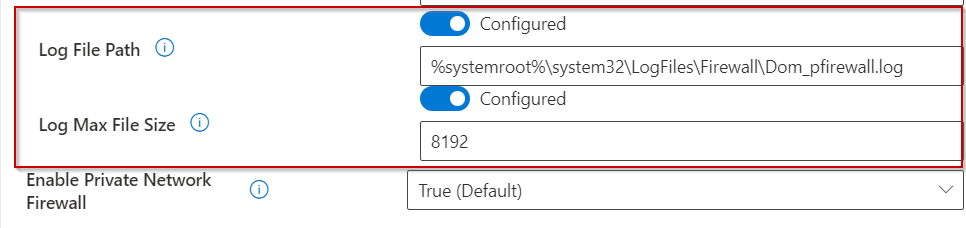
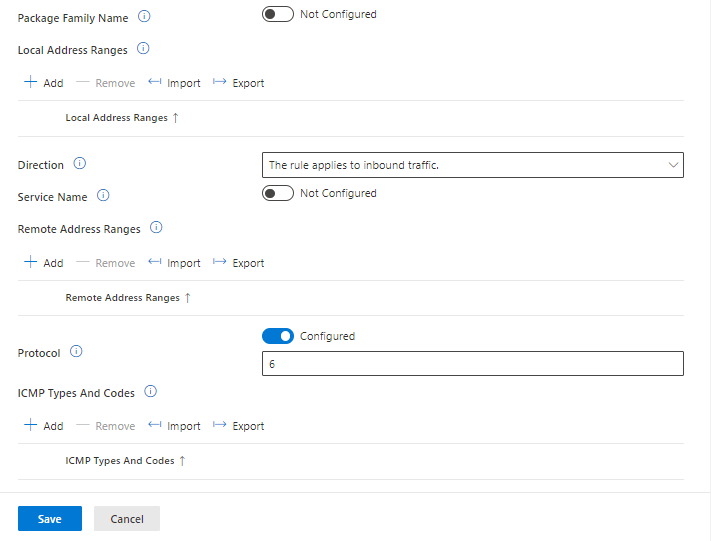
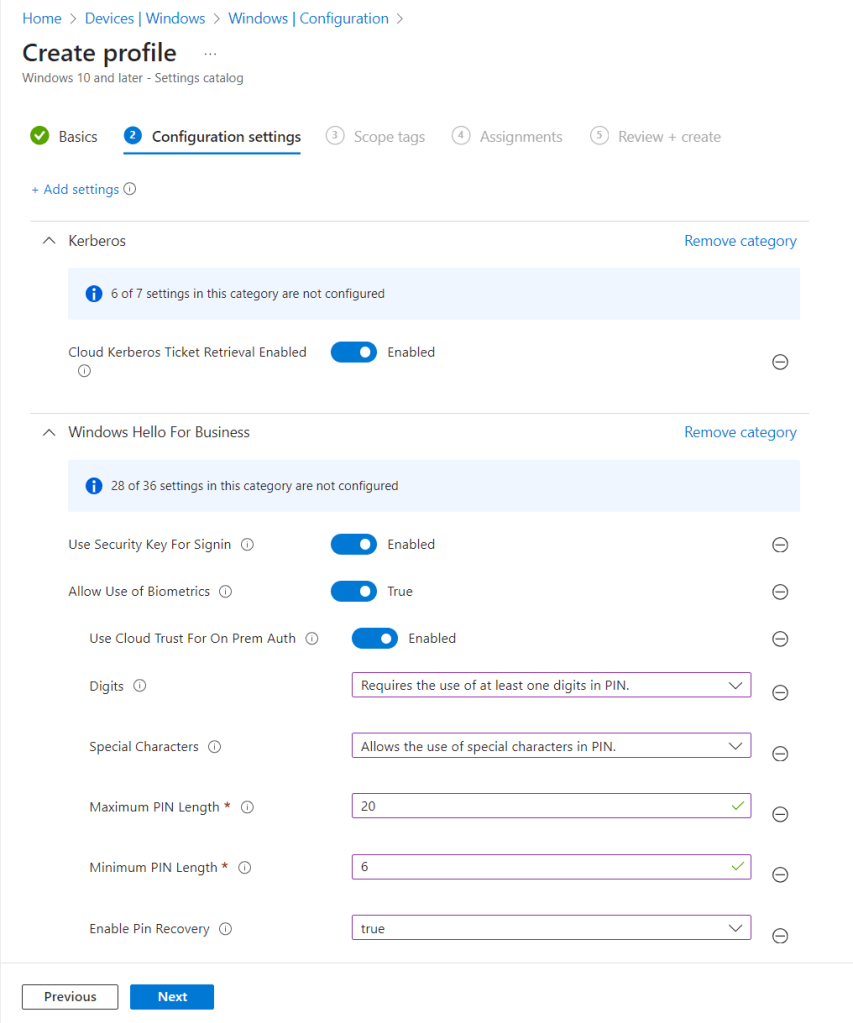
I used the below settings for my pin and we need to enable use cloud trust for on prem auth and Cloud Kerberos Ticket Retrieval.
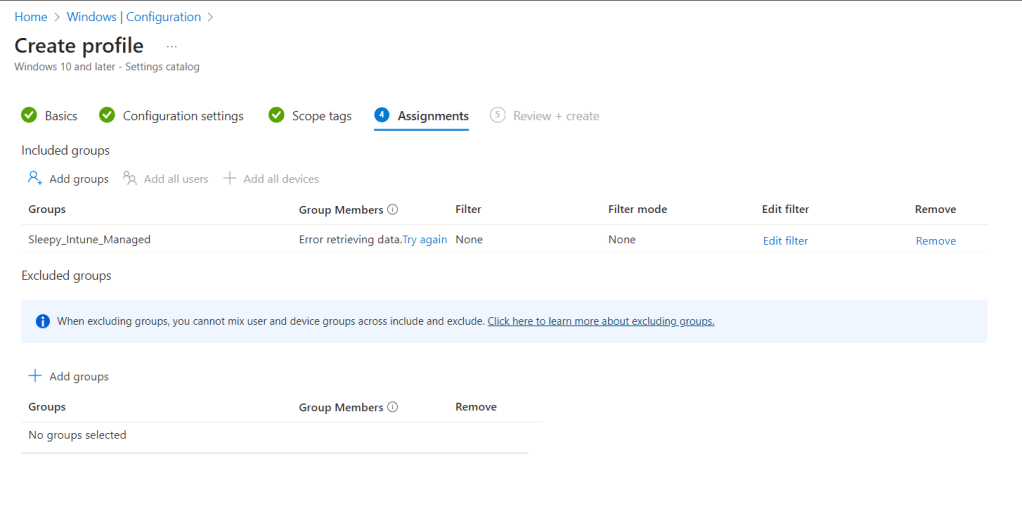
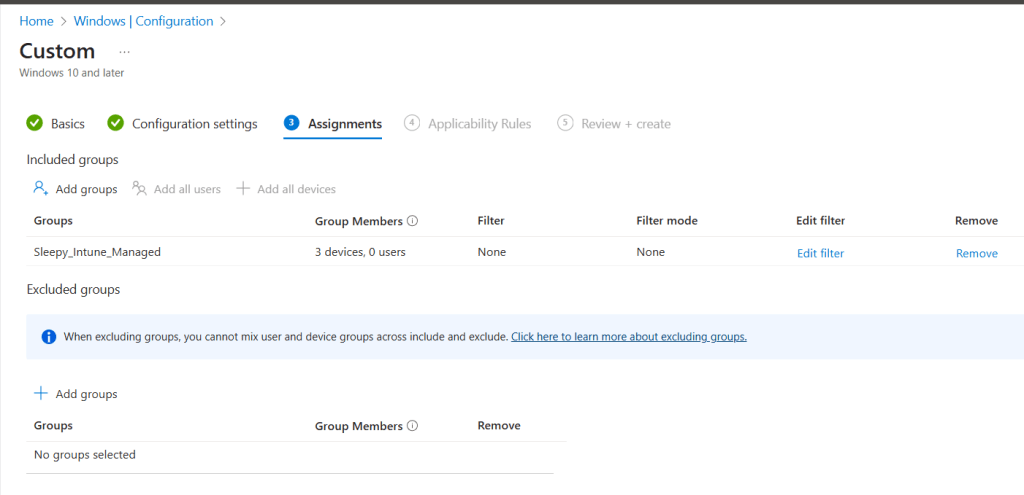
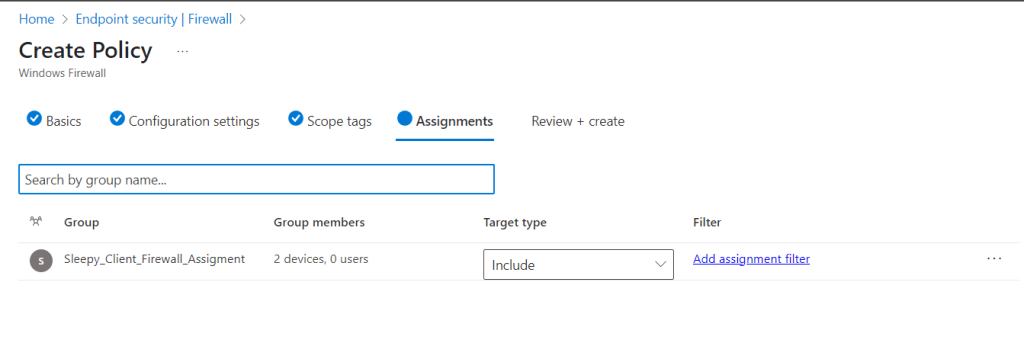
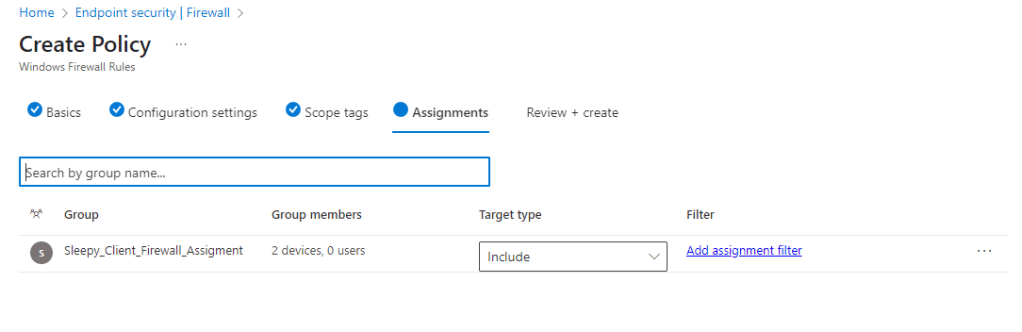
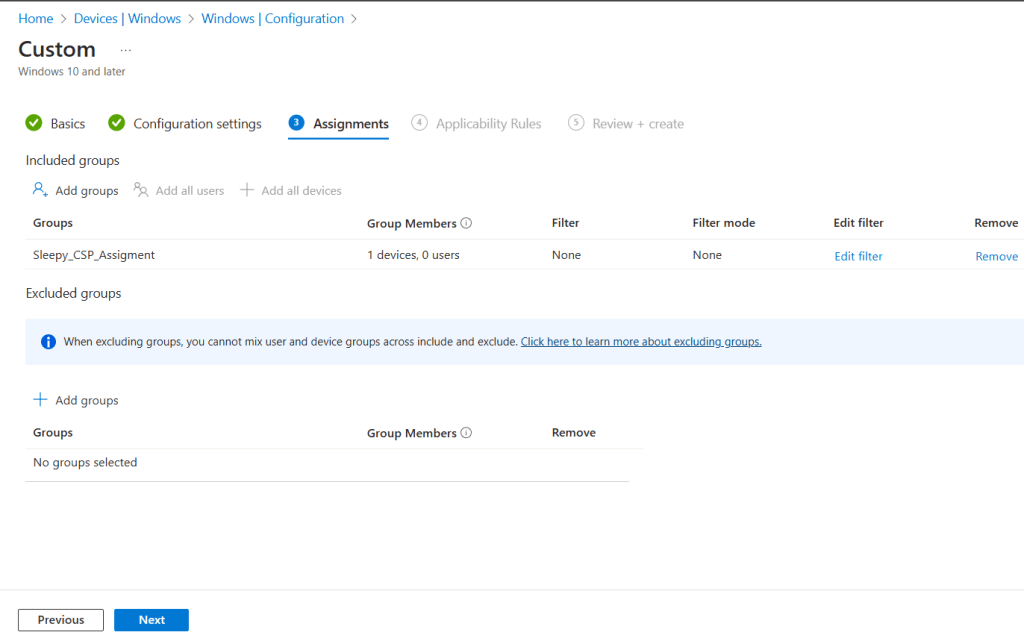
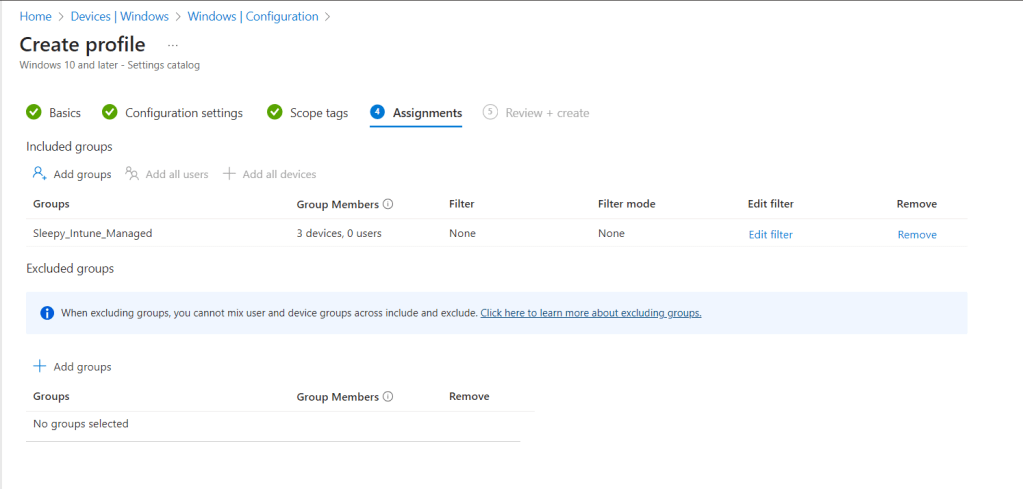
I left scope as defualt and apply the policy to my Intune Managed group.
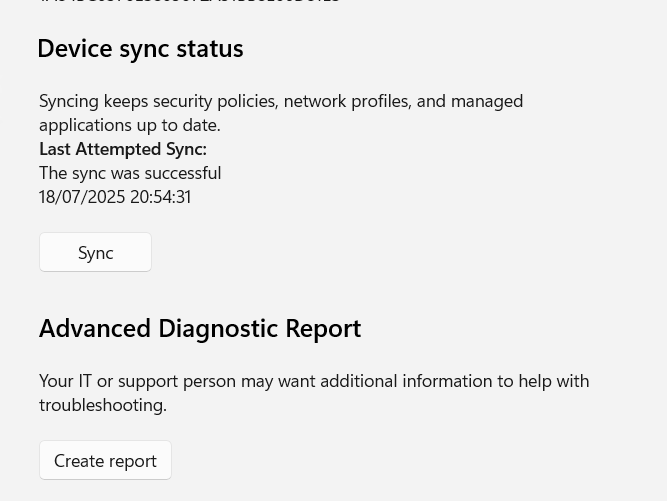
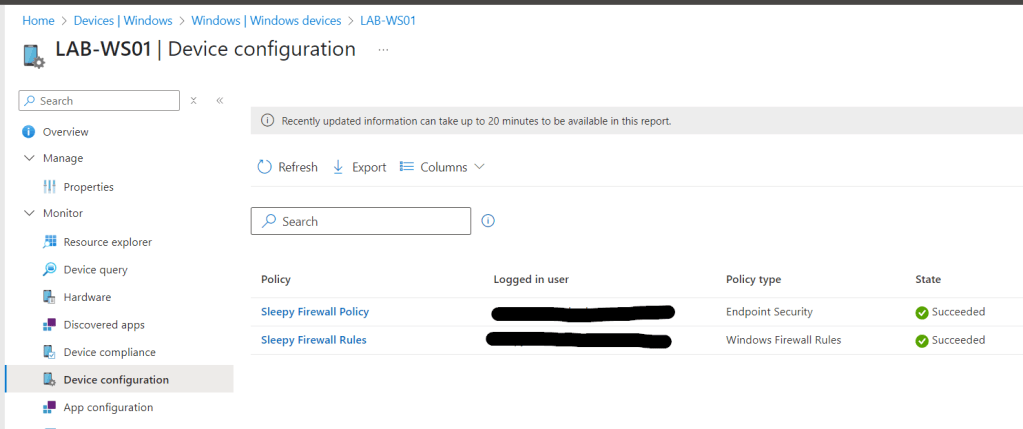
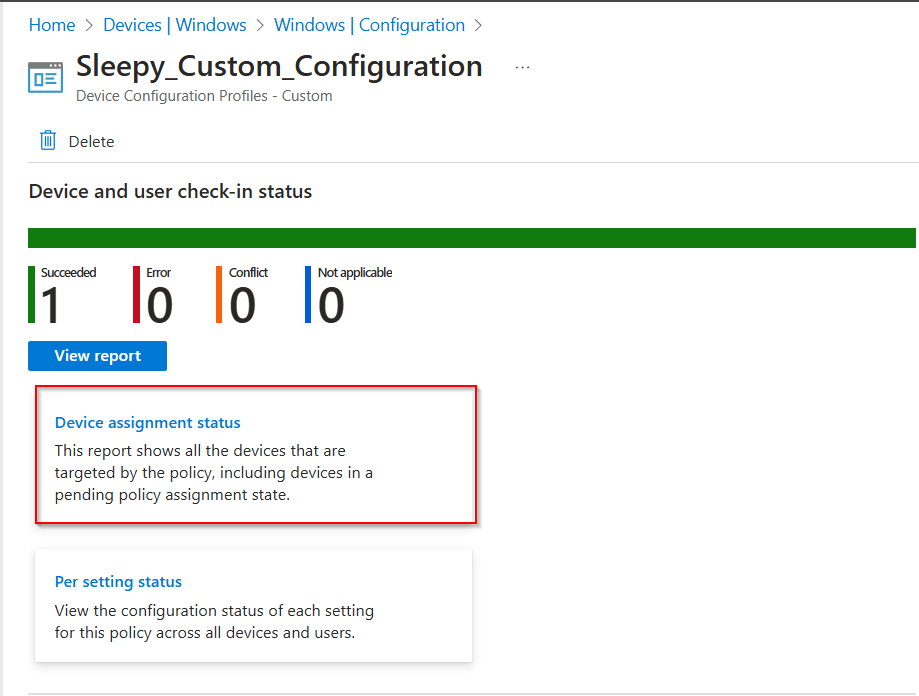
Once the policy is applied we can connect back to the asset and restart.
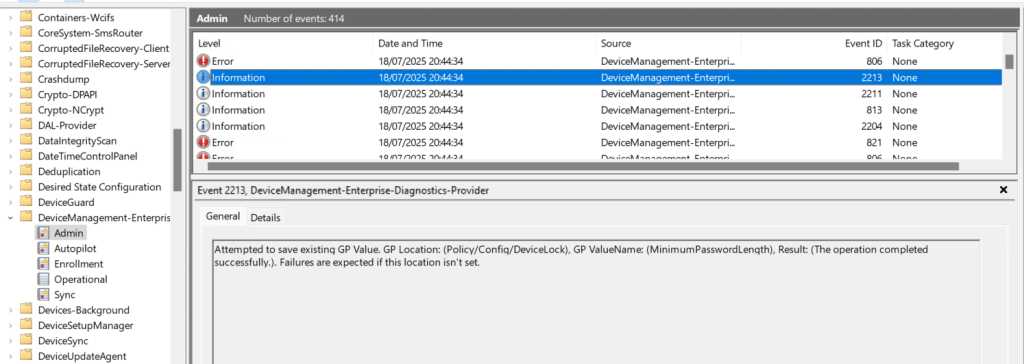
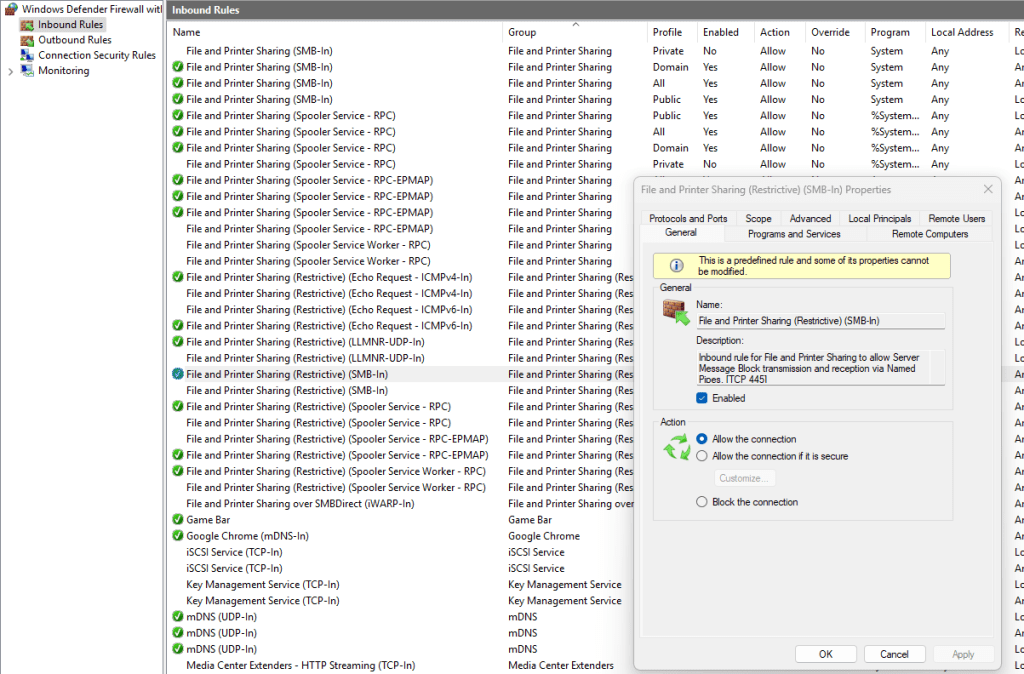
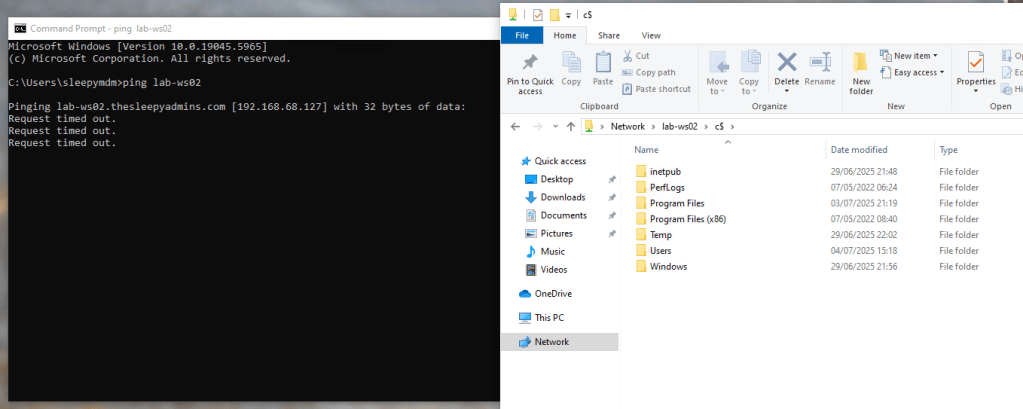
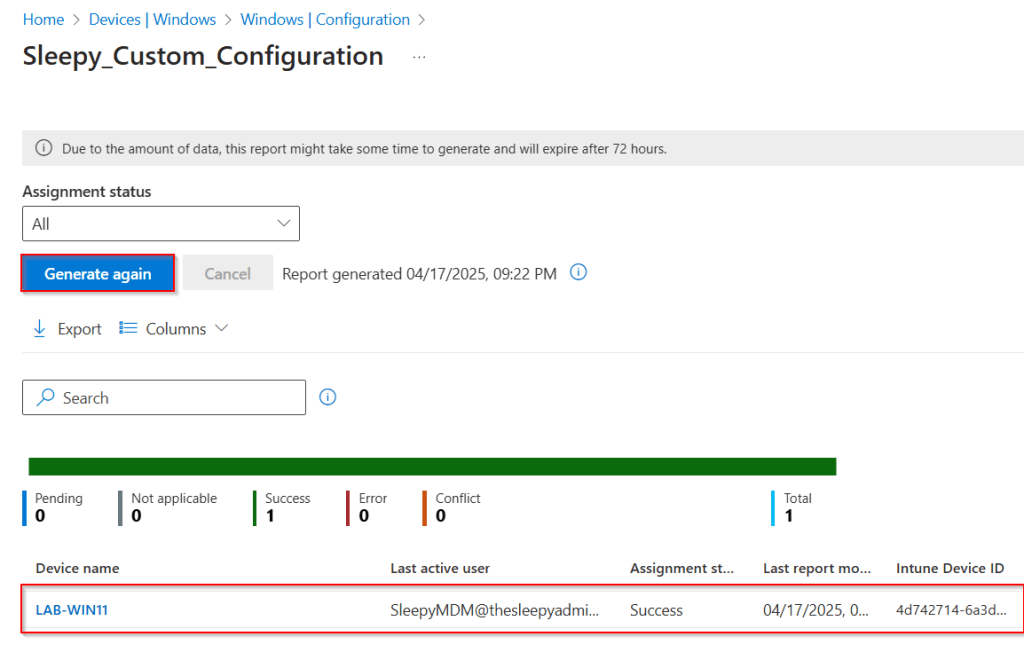
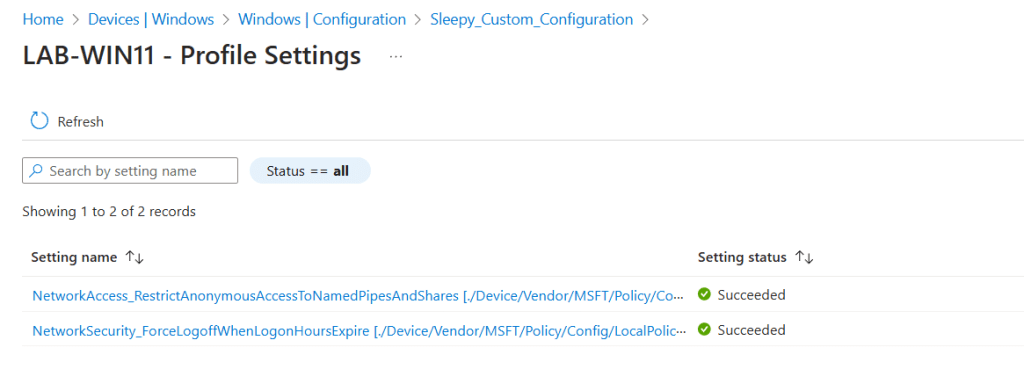
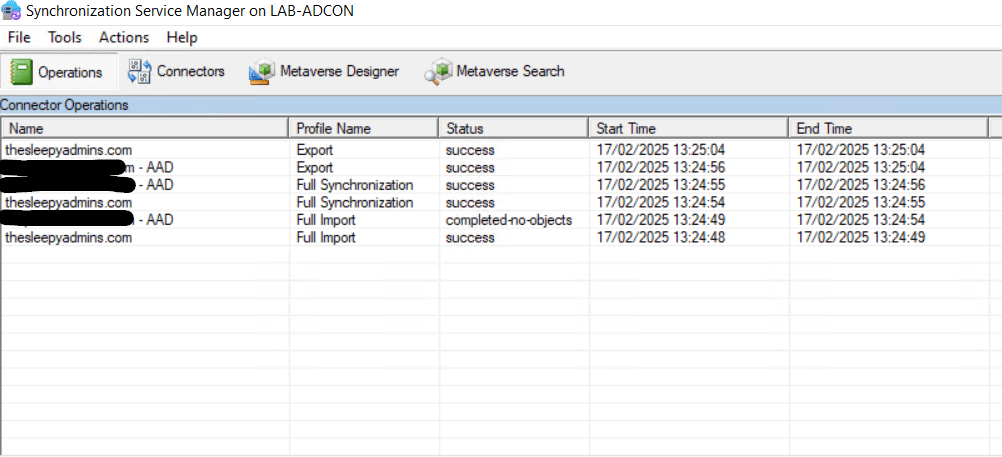
On the next logon if we check we should now be able to connect to onprem resources and get issued Kerberos tickets.
This has been a quick run through of Setting up Cloud Kerberos Trust.