In this post we will go over creating VNETs and subnets using PowerShell, we will also be create a script to use a CSV to deploy multiple VNETs / subnets.
Azure PowerShell is a command-line tool that allows you to manage and deploy Azure resources using the PowerShell scripting language.
Azure VNETs provide a secure and isolated network environment within Azure. Subnets allow you to divide a VNET into smaller, logical segments to control network traffic and provide network segregation.
To deploy Azure VNET and subnets using Azure PowerShell, we first either need to create a resource group or use a pre existing one.
We can create a resource group using Az PowerShell
First connect to Azure PowerShell using
Connect-AzAccount
Once connected if there is multiple subscription make sure to select the correct one before creating the resource group or any other resource.
Next we will create the resource group this requires a name and a location.
New-AzResourceGroup -Name 'resource group name' -Location northeurope
Next we can create a VNET and subnet will be using splatting to specifying the parameters.
Azure File Share is a cloud-based file storage service in Microsoft Azure.
Azure File Share provides highly available, secure, and scalable storage for applications, services, and virtual machines running in the cloud or on-premises. It can be used for a variety of scenarios, including storing files for distributed applications, sharing files across different platforms and devices, and backing up data to the cloud.
With Azure File Share, users can easily store and share files in the cloud without the need for complex infrastructure or expensive hardware.
In this post we will be going through creating a script to report and if required remove files that are older than specific days.
First we need to get the storage account so we can use the context to query the file share.
Get-AzStorageAccount -ResourceGroupName name -Name storageac name
To get Azure file share there is no parameter to use resource group and storage account name so this is why we need to use context.
Once we have the properties we can create the script.
When running the script I have set two parameters. One to export to CSV and second one is to delete the files. If neither are set the script default out to the PowerShell console.
When using the -reportexport it will output to a csv file.
When using -delete the script will remove the files on the Azure file Share.
There is currently a bit of a limitation with Get-AZStorageFile command as it has no recursive parameter so going more than one folder down is difficult so this might not work for everyone.
The full script can be download from the below GitHub repository.
Just wanted to do a quick post as I was having issue connecting to Az CLi. When connection it was failing to validate the login.microsoftonline.com certificate.
I was getting the below verification error.
HTTPSConnectionPool(host=’login.microsoftonline.com’, port=443): Max retries exceeded with url: /organizations/v2.0/.well-known/openid-configuration (Caused by SSLError(SSLCertVerificationError(1, ‘[SSL: CERTIFICATE_VERIFY_FAILED] certificate verify failed: self signed certificate in certificate chain (_ssl.c:997)’)))
The issue looked to be caused by the SSL inspection being done on the firewall. To check the cert being used by the firewall I used the developer mode in Edge using F12. When in the developer mode go to security and view certificate.
There where a few different recommendations online to set environment variables and run python commands but none of these fixed the issue for me. These where all related to connection request going proxy but in this case to I wasn’t using a proxy.
I tried the python command to use the local system cert store but this didn’t work, someone said to try add the cert file content to the cacert.pem file in the Microsoft SDK. I tried to add it manually to cacert.pem.
Below steps fixed the issue for me.
Using MMC console, export the root cert from my local cert store that was used for the SSL inspection as Base-64 encoded
Use OpenSSL to view the cert content I used “openssl x509 -in ‘Firewall_Root_Cert.cer’ -text” ( can also use notepad but that doesn’t have the issuer or subject details)
Go to C:\Program Files (x86)\Microsoft SDKs\Azure\CLI2\Lib\site-packages\certifi\cacert.pem
Open using NotePad ++ or notepad and then added the cert content to the bottom after the last cert
Below is the updated cacert.pem file.
Once I added the root cert content, I was then able to connect without issue.
If you’re an Azure administrator, you’re likely familiar with the concept of service principals.
These are application identities that are used to manage access to Azure resources. Service principals are an important part of Azure security, but managing them can be a challenge.
In this blog post, we’ll go through listing service principals and exporting details and group membership.
First we need to connect to Azure using Microsoft GraphSDK, the two permission required are Group.Read.All and Application.Read.All
Next we can use to list all service principal
Get-MgServicePrincipal -All: $true
We can use the Filter parameter to select only the principal that we want to check.
Next I wanted to check what groups the principal was a member off. To do this we can use the ID property and the below command.
We can then use the ID to get the group display name
Get-MgGroup -GroupId
Now that we have the service principal and groups we can create the report script. We will be exporting the Displayname, ServicePrincipaltype, AccountEnabled, AppId, createddatetime and groups.
There are three parameters in the script, ServicePrincipals is used to specify the name or names of the service principals to check.
The ConsoleOnly returns results directly to PowerShell console
If using the reportexport parameter the results will be exported to CSV
The script can be run against one or multiple service principals to report on more than one.
To search more than one use , between the names.
The full script can be downloaded from the below GitHub link.
In this post we will be going through the process of setting up Azure Backup Email Reporting.
First step is to configure the Azure Backup Reporting, for this you will need to have already configured at least one Azure Recovery service vaults and have backup running.
I have gone through this process in a previous post so wont be going over here. see previous post for steps involved.
Once we have the backup vault and backup configured we need to configure an Log Analytics workspace to send diagnostic data to so the reports can generate data.
To create a Log Analytics Workspace go to the Azure Admin portal > Log Analytics workspaces.
Click create
Select the resource group the workspace will be created in, give it a name and select the region.
Add tags if required and create.
Now that we have the log workspace we can configure the backup vault to send diagnostic data.
Go to Backup center > Vault
Select the vault that will have diagnostic enabled and go to Diagnostic settings.
Give the diagnostics a name, select the Azure backup category’s and send to log workspace. Select the log workspace to send to.
Click save it can take a few hours before data starts to show in the workspace.
To check that the backup report are showing data,
Go to Backup center > Backup reports and select the workspace from the drop down list.
Click on summary tab to view the summary report.
Once we have reports working we can now configure the email reporting.
To configure email reporting,
Go to Backup center > Backup reports > Email Report
Give the task a name (this will be the name of the logic app), set the subscription, resource group and region.
We will also need to set email frequency, destination email address and email subject.
There is a bug in the naming of the task it suppose to allow hyphens but the UI gives an error if you use them. The work around to this is to create without the hyphens and then once the logic app is deployed clone with the correct naming.
Once the logic app is created if we want to use hyphens, go to Clone and use hyphens for the name of the cloned logic app.
Then remove the logic app without the hyphens.
Next we need to approve both the API’s
On the Office365 API authorize the account that is authorize will be used to send the mail so if there is no mailbox associated against the account you will receive an error like the below.
“Office 365 Outlook” connector Error:- REST API is not yet supported for this mailbox. This error can occur for sandbox (test) accounts or for accounts that are on a dedicated (on-premise) mail server
To use a Shared Mailbox the Logic app will need modified the send a mail v2 action and add in a from address and use an account that has send as permission set on the mailbox.
Once both API have been authorized we can run the trigger to test the job.
The backup report should then send.
To modify the time that the mail is sent at, we will need to set the time in the logic app. Open the logic app designer and add a new parameter under Recurrence.
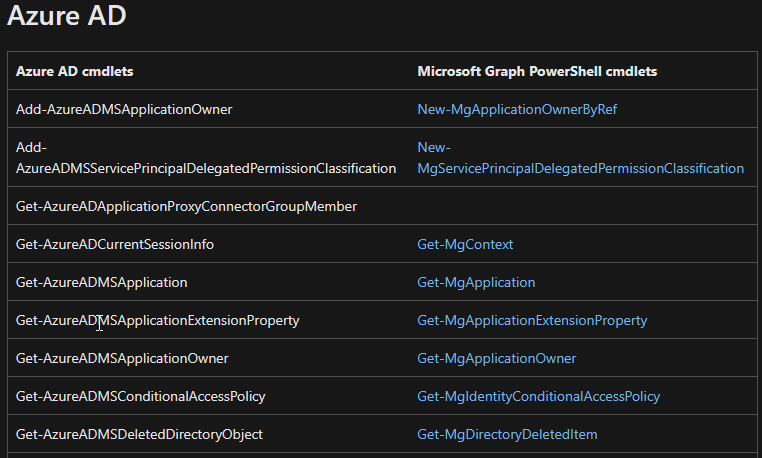
Support for both Azure AD and MSOL modules have been extended to allow the updating of scripts and I would presume due to some command not existing in Graph yet. The modules will be deprecated in June 30th 2023 so any scripts using command with either of these modules should be updated as soon as possible.
In this post we will be going through some common commands that use either the Azure AD or MSOL PowerShell modules and how to find commands that will replace them in Graph and using the scope roles to set required API permissions.
First stop I usually do is to check if the commands have direct replacements, we can use the below learn page to check. The page will have tables with the Azure AD / MSOL command and then the replacement command if one exist in the second row.
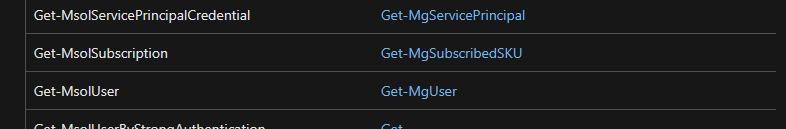
For the below reference we will be using Get-MsolUser if we check the document that command is replaced by Get-MgUser.
Now when connecting to Azure AD or MSOL all commands and permission are based on the role of the account you sign-in with.
If we connect with MSOL we can query users once we have the required role.
For Graph the way to connect is slightly different if we don’t specify a scope when connecting, we can connect but we don’t automatically have the require API permission assigned so if we run the Get-MgUser command we will get an error for insufficient privilege’s
If we add the -scope User.Read.All
If we want to check what permission are available for a command we can use Find-MgGraphCommand with the command we want to check. We can also use the apiversioni (v1.0 or beta)
Depending on what task we are trying to do we can select the required permission, one example is if I just want to get back information on account’s I would just use User.Read.All. If I wanted to change a users settings I would use the User.ReadWirte.All.
Another difference between modules is that in Graph there is no -userprinicpalname parameter and uses UserID instead
To get licenses assigned to a user we can use.
Get-MgUserLicenseDetail -UserId UPN
As we can see Microsoft Graph has a few differences and instead of having most data under single objects like Get-MsolUser we have to now use multiple commands to return the same data which can be a bit more difficult when starting out.
From time to time we need to check that VMware Distributed Port Groups are following our standard configuration. If there is only a few port group this can be done manually but in my case I need to check a few hundred.
Since there are so many I wanted to make a script that will export the configuration of each port group and out put to a CSV.
In this post we will be going through using PowerCLI to report on the configuration setting for all distributed virtual switch port groups.
I used the PowerCLI developer doc to find the required commands to check each port group configuration settings and policies.
Azure NSG flow logs are a feature of Azure Network Security Group (NSG) that allows administrators to track and monitor network traffic flowing through their Azure virtual network.
The flow logs provide detailed information on the source and destination of the traffic, as well as the protocol and port being used. This information can be used to identify trends and patterns in network usage, as well as to detect and troubleshoot potential security threats.
Azure NSG flow logs provide a valuable tool for administrators to maintain visibility and control over their Azure network environment.
To set the NSG flow logs to be sent to Log workspace we can use Traffic Analytics.
In this post we will be going through enabling NSG Flow Logs, enabling Traffic Analytics and reviewing the logs for allowed and denied traffic using Azure Log Analytics Workspace.
There will be a cost for using the Azure Storage, workspace and Traffic Analytics so confirm these before proceeding as the more data sent the more it will cost.
When creating a new deployment in Azure it is good security practice to restrict access between subnets to the required ports only. This can sometimes be a bit difficulty if the application communication is not fully documented.
This is where NSG Flow can be used as we can use this to review the traffic between the subnets going over the NSG’s. There are some prerequisite for this
Storage account in the same region as the NSG
Log Analytic workspace
Network Watcher (this should be created automatically once a vNet is created)
Network Security group
VM running in two network and have an NSG assigned
Once all the above are ready we can start to enabled the logging. NSG flow can be either enabled from NSG directly or through Network Watcher. We will be doing this in Network Watcher.
First step is to go to Network Watcher > NSG Flow
Select the required Subscription, the required NSG’s, storage account and retention (0 on retention means the logs are kept forever) since this is a test environment I will only keep the logs for 5 days.
On configuration select version 2 and enabled traffic analytics. On traffic analytics set the process interval to either 1 hour or 10 mins, select the subscription and workspace.
Apply tags if in use, then review and create.
The deployment should only take a minute or so and then the NSG flow should show as succeeded.
Once enabled it can take little bit for data to start showing. We can check that the container has been create on the storage account.
Open the storage account and go to Containers there should be a new insight-logs container.
If we navigate down the folder structure there will be a JSON file that has all the NSG access requests, we could use the JSON file it self but it pretty difficult to read.
To check that data is going to the workspace, go to Log Analytics Workspace. Select the workspace we used earlier.
We will use the AzureNetworkAnalytics_CL table and flowlog to view the data. I used the below Learn article to help understand the table / fields and create the queries.
Now that we have confirmed data is being shipped to the log workspace, we can start to create the KQL query that will show all traffic between the specific IP of the servers.
The below query will return inbound and outbound request for specified source and destination IP
With the release of VMware vCenter Server Appliance 8.0 (vCSA), I wanted to upgrade my lab setup to the latest release to check out some of the new features.
In this post we will go through the process, this is be the same process as previous version of vCSA just some of the wizard screen have changed slightly.
Before starting the upgrade process make sure you have a valid backup and I also take a snapshot of the existing vCSA just incase there are any issues.
Next, I usually rename the existing VCSA to _old as I want to deploy to the vCenter with the same name.
Next, we can mount the vCenter ISO to launch the installer.exe.
Next on the install select upgrade.
The introduction will warn that if using an external PSC it will be converged as external PSC are being deprecated.
Next accept the end user agreement.
Put in the details for the existing Appliance.
We will have to put in the details of the existing vCenter or ESXi host. My vCSA is installed on a standalone ESXi host, so I used those details.
If there is a cert warning accept to continue.
Enter the details for the target server where the new vCSA is going to be deployed to.
Enter the existing vCenter server name (as long as you renamed the VM name first)
Select the VM size.
Select the datastore to use.
Next, we need to select the network and give the vCSA a temporary IP, this is to allow it to be contactable so that the data migration can happen. After the data migration the original IP will be moved to the new vCSA.
Now review the deployment details.
Click finish to start the deployment.
Once the deployment is completed, we can start stage 2.
Click continue
Next we will go through stage two of the upgrade.
First part will verify the connection and run pre-checks for any issues.
Review these result to confirm there will be no issues. .
Select what data to move.
Tick to join customer experience or not and continue.
Review the settings and confirm everything is correct.
Click finish to start the data transfer.
The data migration can take a while depending on the amount of data to be moved.
Once completed we can now logon to the vCSA and confirm that we are running vCenter 8.0.
One way to limit the communication is to use NSG’s.
In this example we will be using a 10.10.1.0/24 address space
Address Space
Then we will be creating multiple subnets with /28 mask.
Subnets
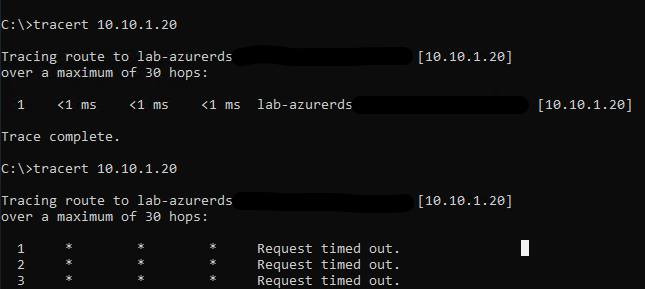
I have added one server to both the Ops and Mgmt subnets. Now if we make a connection between each VM the traffic will be routed directly between both VM’s.
trace route
Next, we will setup the NSG to only allow connection between the subnets for RDP and SMB. In this case we will be creating an NSG per subnet, but this could be done in one NSG.
Network Security Group
Next, we need to create two new inbound rules one to allow the required ports and the second to deny all other access.
Go to inbound rules and select Add.
Add rule
Added in the required details
·Source: IP Address
·Source Port:
·Destination: IP Address
·Destination IP Address:
·Service: Custom
·Destination Port Ranges:
·Protocol TCP
·Action: Allow
·Priority: 110
·Name: Allow_Mgmt_Subnet_Access
Allow inbound rule
Next, we will create the deny rule.
Deny inbound rule
I would usually set the deny to a much lower priority, so that if more rules are required in the future there won’t be an issue with the deny rule having a higher priority and blocking the traffic.
Once saved, the allow and deny rule should show under inbound rules.
Now when we try to run tracert again, this time we won’t be able to connect.
Tracert
If we try open a connection using SMB, we can connect without issue.
To block access back to the other subnet we will need to create the same rules but with the opposition subnet source and destination IP ranges.
After creating both set of NSG rules there will be no access between the subnets on any port other than those specified in the inbound rules.