
In the previous four post’s we went through installing and configuring the vROps virtual appliance, connecting to vCenter server, configuring Window Active directory as an identity source and create custom alerts and notifications.
Part 1: Install and Configure vRealize Operations Manager 8.2 Part 1 – TheSleepyAdmins
Part 2: Install and Configure vRealize Operations Manager 8.2 Part 2 Connect to vCenter – TheSleepyAdmins
Part 3: Install and Configure vRealize Operations Manager 8.2 Part 3 AD Authentication – TheSleepyAdmins
In this post we will be creating a custom dashboard. Dashboard can be used to visual your VMware infrastructure, view performance issue and capacity planning / right sizing. Dashboards are made up of views and widgets.
We can create custom dashboards or clone and existing dashboard and modify that to add addtional view or widgets.
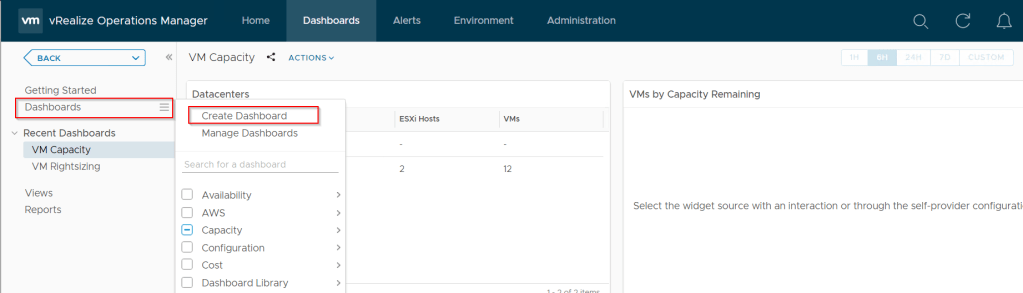
To create a new dashboard logon to the vROps web client > Dashboards > Dashboards > Create Dashboard
Give the dashboard a name and we can toggle between view and widgets using the below button.
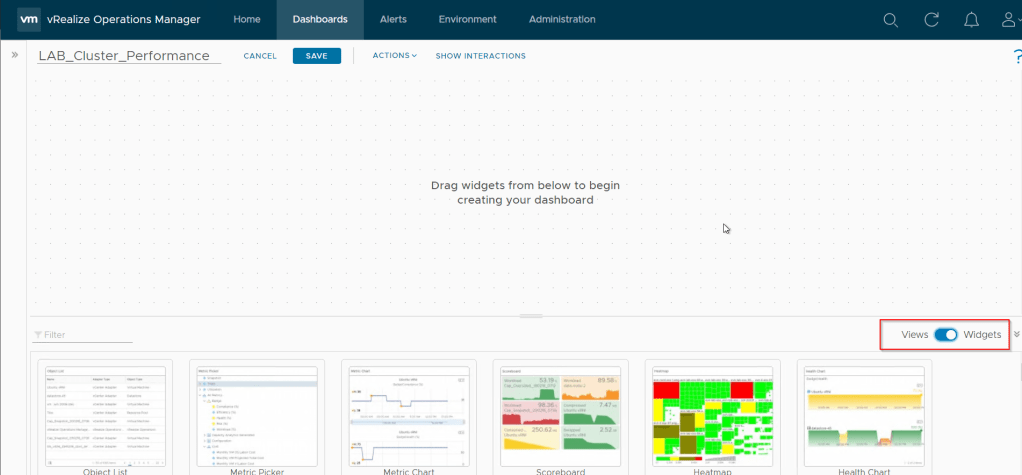
Start adding the required views / widgets for the dashboard in this dashboard we are looking for performance related.
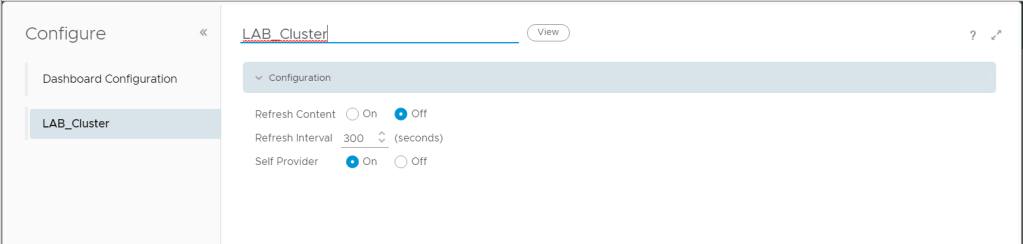
First we will add a view list that we will use to create an relationship with the other widgets.
Give the view a name and select if the content should be refreshed or not. Since I want to specify the cluster I will be setting self provider to On. If this is not set to on input data object will be greyed out
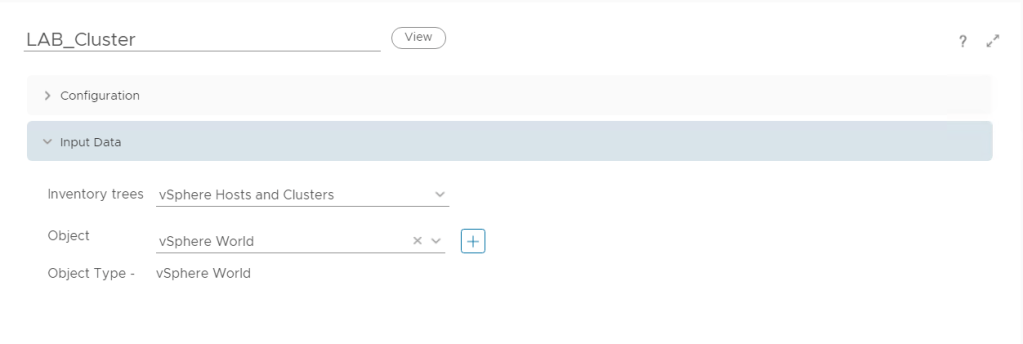
Next we need to specify the object under the inventory tree. We will be using vSphere Host and Clusters and the object will be vSphere World.
Under output data we will use cluster utilization.
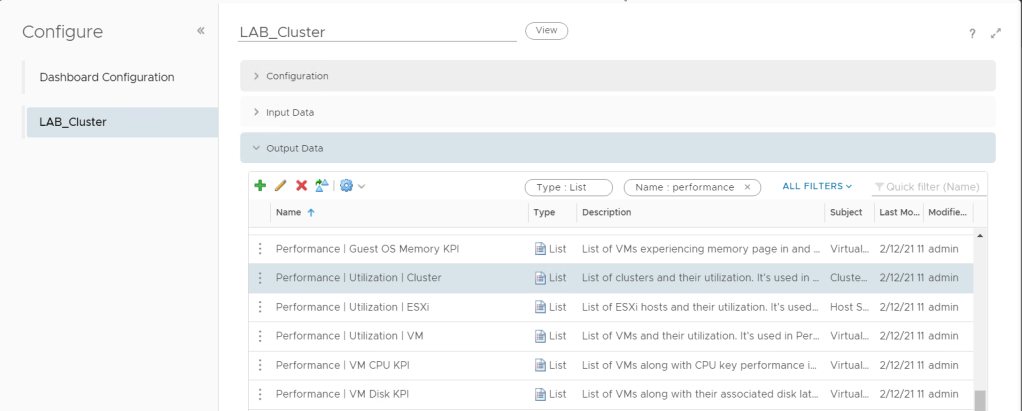
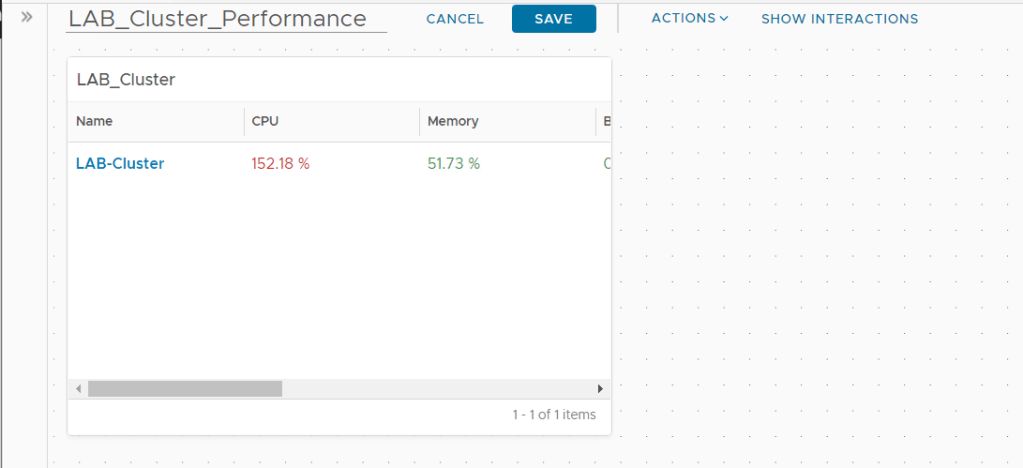
Click save and output should look like the below.
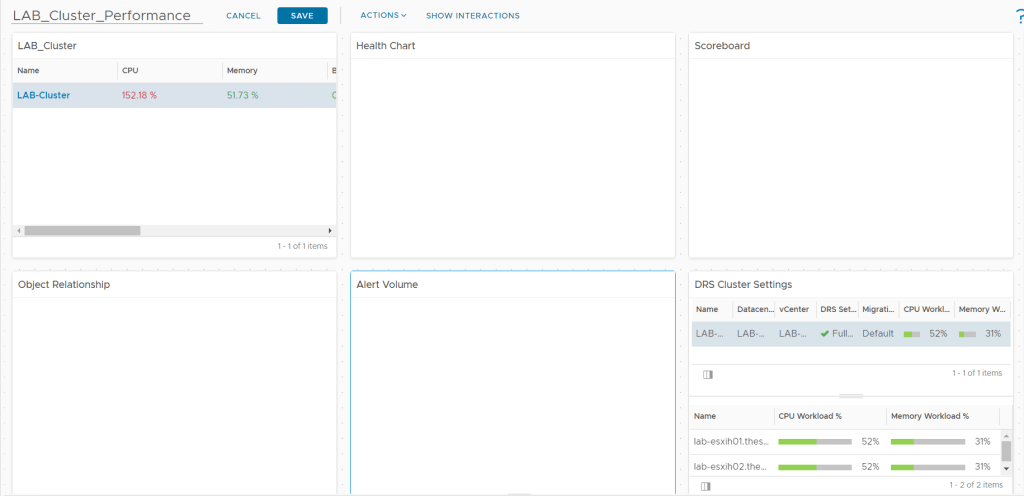
Once we have the view we can add the addtional widgets and start creating the interactions.
No data will be showing till the Interactions are in place.
After adding in the required widgets and click on show interactions.
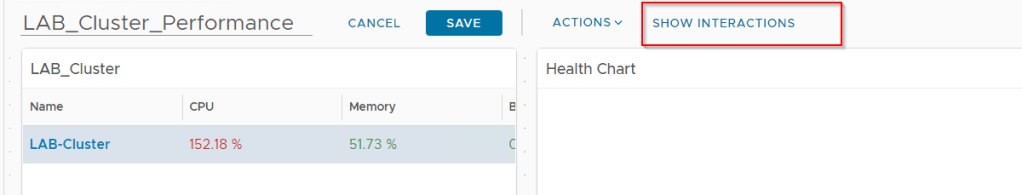
Now we just connect the LAB_Cluster view to the other widgets we just added.
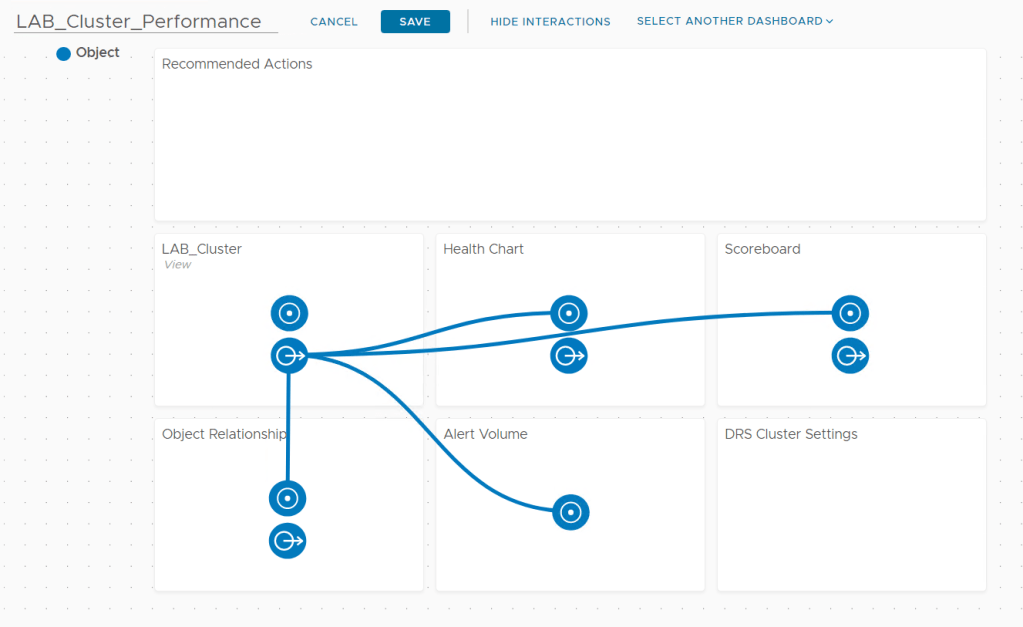
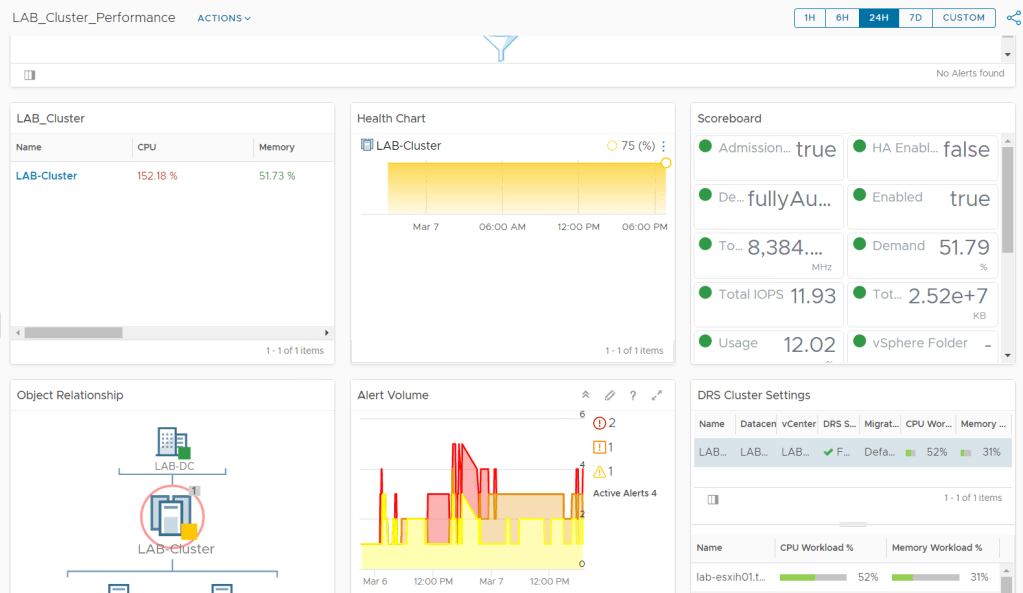
Now if we select the cluster view we will have alert volume, health data, scoreboard and object relationship information returned.
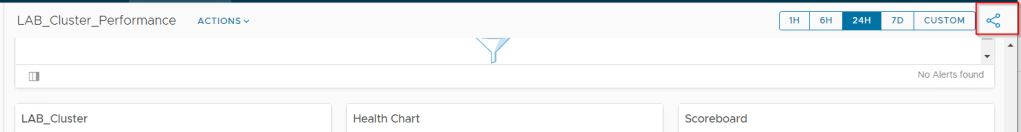
If we want to share the dashboard with other users we can select share icon
Click on groups and select the group to be included.

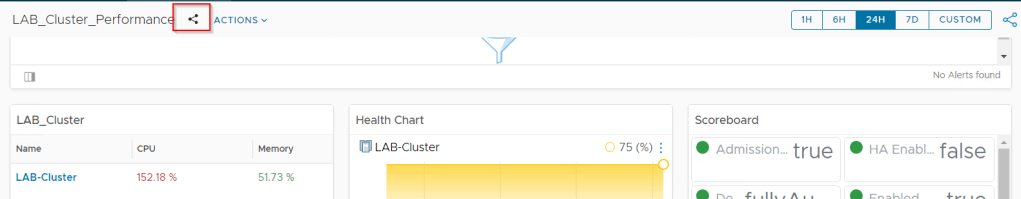
Now share icon should show beside the name of the dashboard.
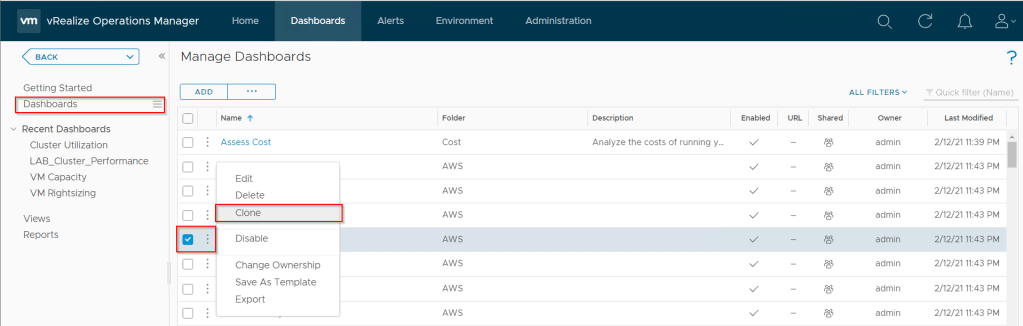
If there are pre existing dashboard that we want to customize we can clone these by going to Dashboards >> Manage Dashboards, select the dashboard you want to clone, click on the three dots and select clone.
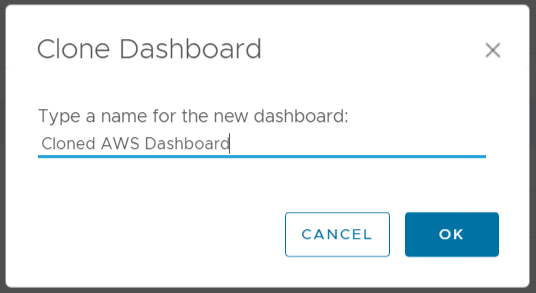
Give the dashboard a name and we can then start to modify.
In the next post we will go through scheduling reports and updating vROps appliance

2 thoughts on “Install and Configure vRealize Operations Manager 8.2 Part 5 Create a Dashboard”