In this post we will be going through creating an alert rule using Azure monitor and custom log search.
This can be setup for for most services in Azure that are set to use Azure log work space or have activity logs but we will be setting up for a Azure VM in this post.
We needed to create an alert for a specific server that we have powered off and wanted to be alerted when it was powered on.
There is no out of the box alerting for this, we end up deciding to use an alert rule with a KQL query.
First we need to logon to the Azure portal and go to the VM we wanted to alert on.
Select Alerts blade and create custom alert rule.

Select custom log search from the drop down signal name.

Add the search query. I used the AzureAcitivty table and search for the operation value name for virtual machine start action.
AzureActivity
| where OperationNameValue == 'MICROSOFT.COMPUTE/VIRTUALMACHINES/START/ACTION' and ActivityStatusValue == 'Success'
| where EventSubmissionTimestamp >= (ago(2h))

We will also need to set the required measurement type, aggregation type and aggregation.
I used count as I want to alert when there is a count greater than 1, as this will mean the VM has been booted up.

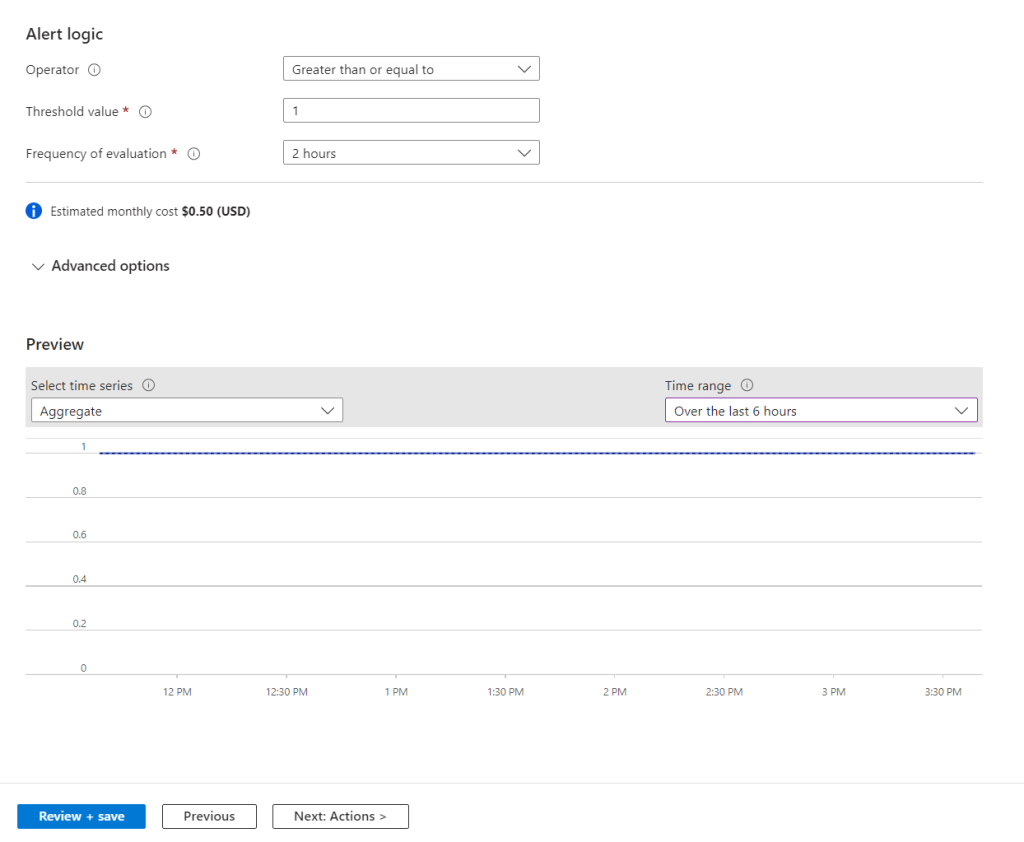
Next we need to set the alert logic.
Set the operator, threshold value and frequency check for the alert. I set the threshold to greater than one alert and evaluate the logs every 2 hours.
We can change the preview to view the current aggregate, which is one for me as I started the VM earlier in the day.
Next we need to either create a new action group or use a pre existing one. I will be creating a new group.
This can be set to send email, SMS message, push notification or voice message.

Next we need to set the subscription and resource group for the alert. We will also set the alert rule severity, name, description and region.

We can also set advanced option like automatically resolving alerts.

Next we set the tags to be used, if required.
Last step is to review and confirm all the settings.

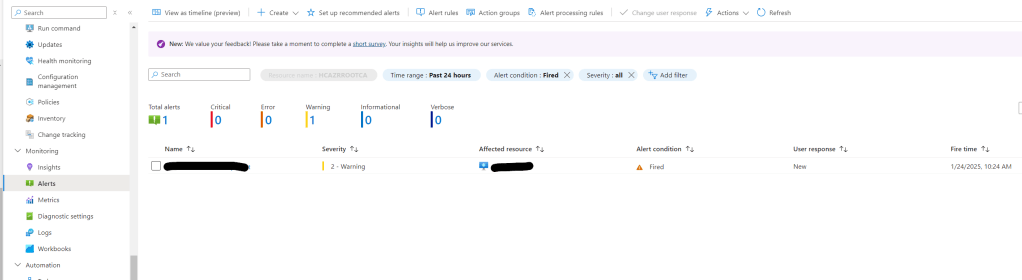
To test we can Power on the VM and check if the alert fires in the Azure portal and we received the email alert.

Setting up alerts using custom log search’s can be very usefully especially if there is no out of the box report.


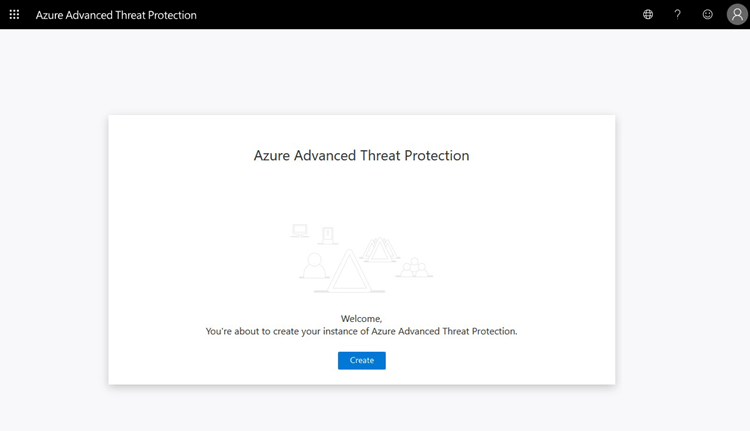 Once the workspace has been created we need to configure the on-premises connection account.
 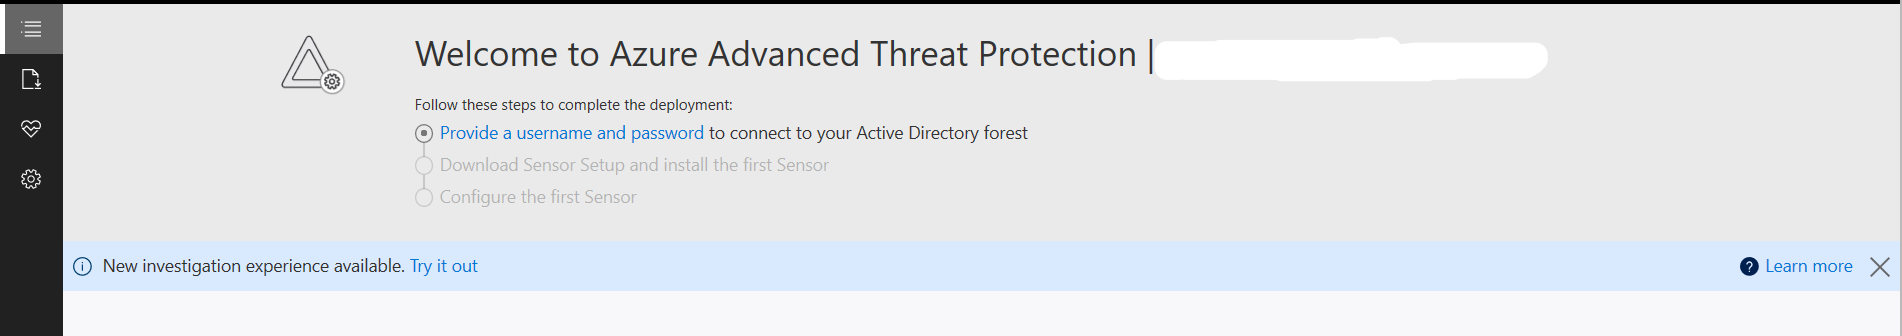 Put in details for the domain account, I used a service account that has read access to AD so that I could restricted the logon to the account to only be used for ATP
 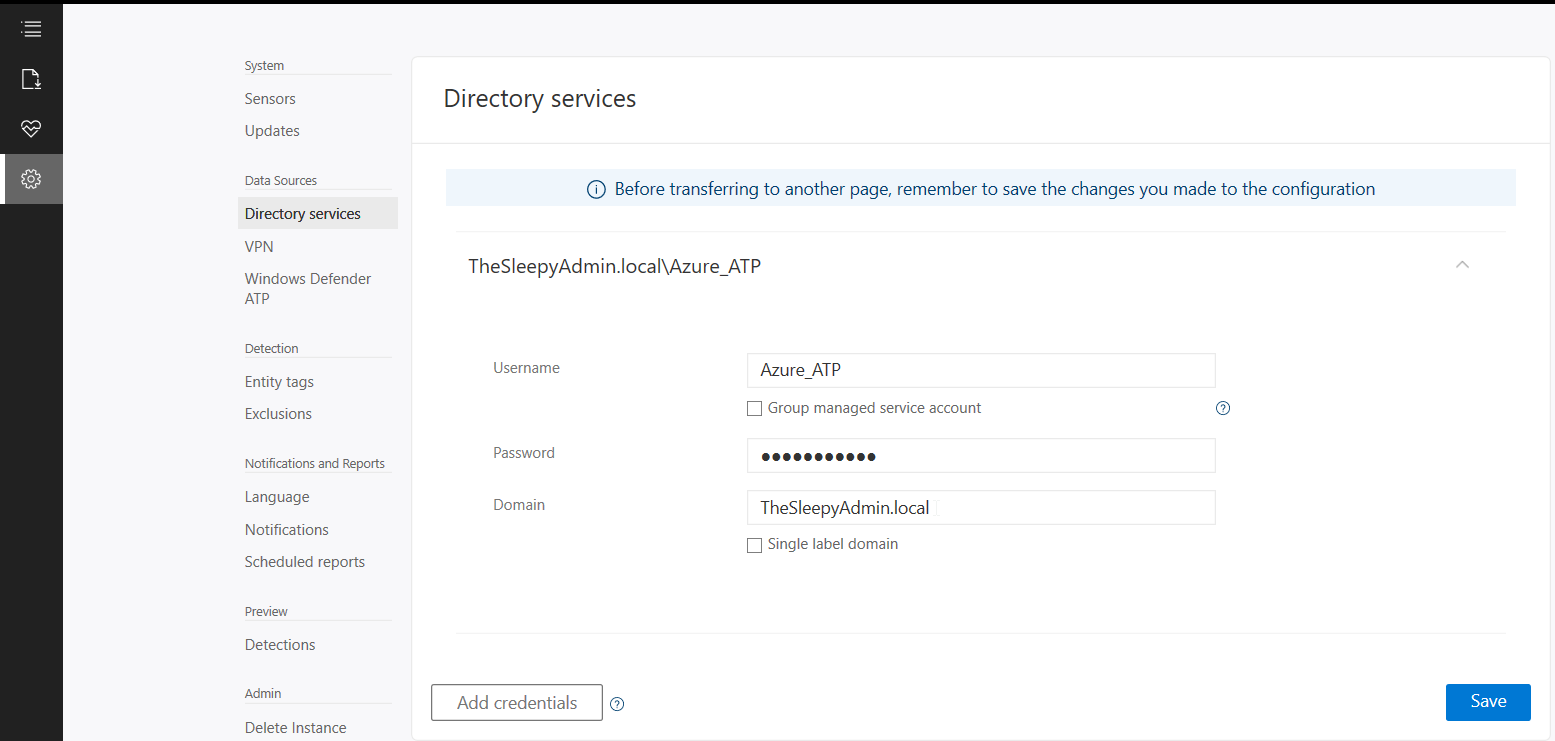 Once AD details are added next step is to download and install the sensor agent. Go to sensors and download the setup exe and copy the access key as this will be required during the install.
 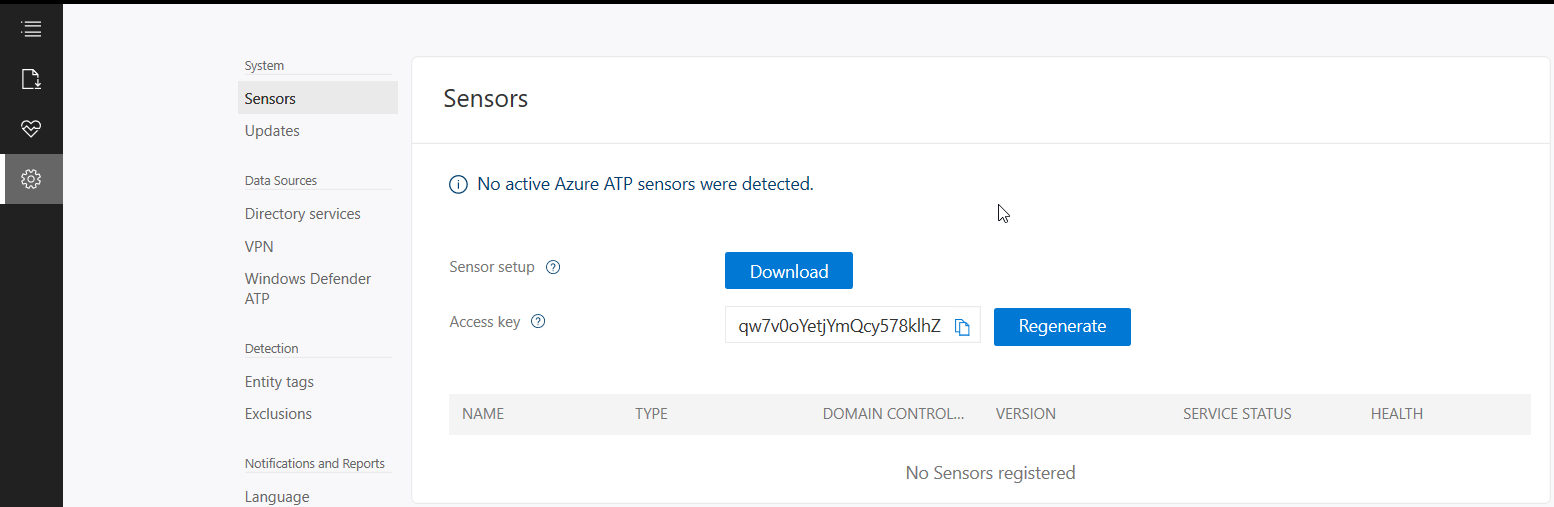 Copy the installer to the DC and run.
  Select required language.
 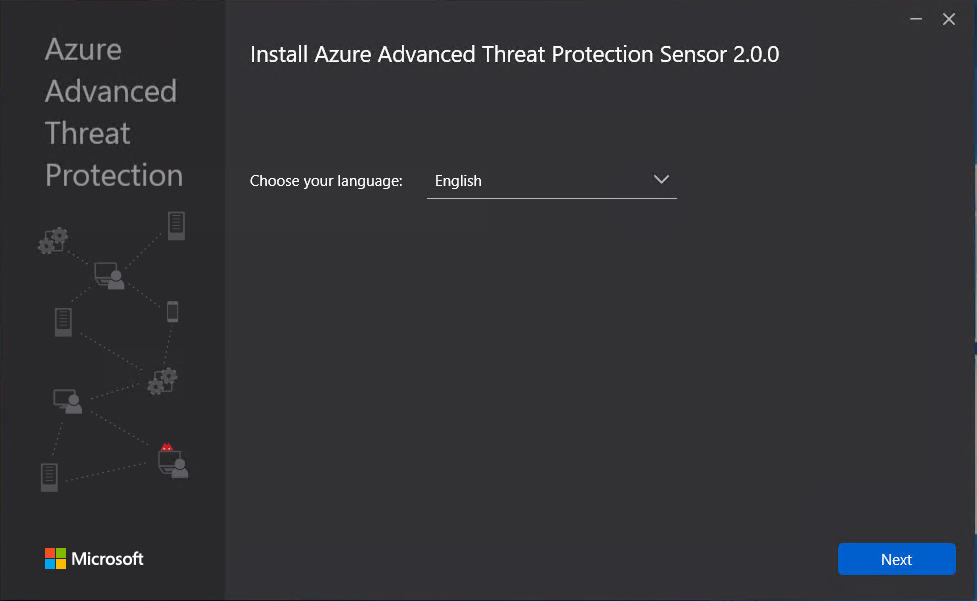 Deployment type will be sensor I am running on VMware and this will generate the below warning which will redirect to a guide to disable IPv4 TSO Offload.
 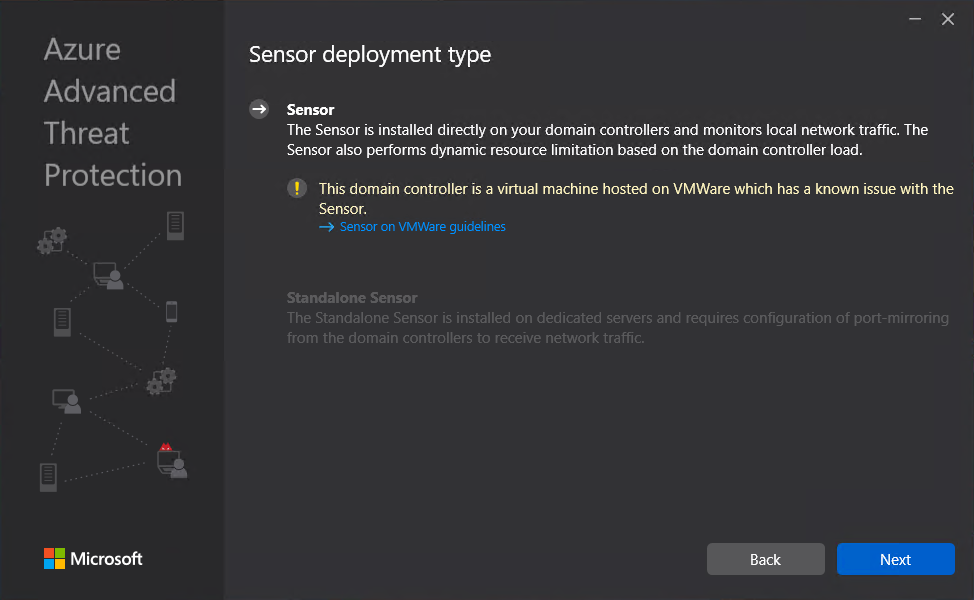 This is where we need to put in the access key so that the sensor is associated to the correct workspace.
 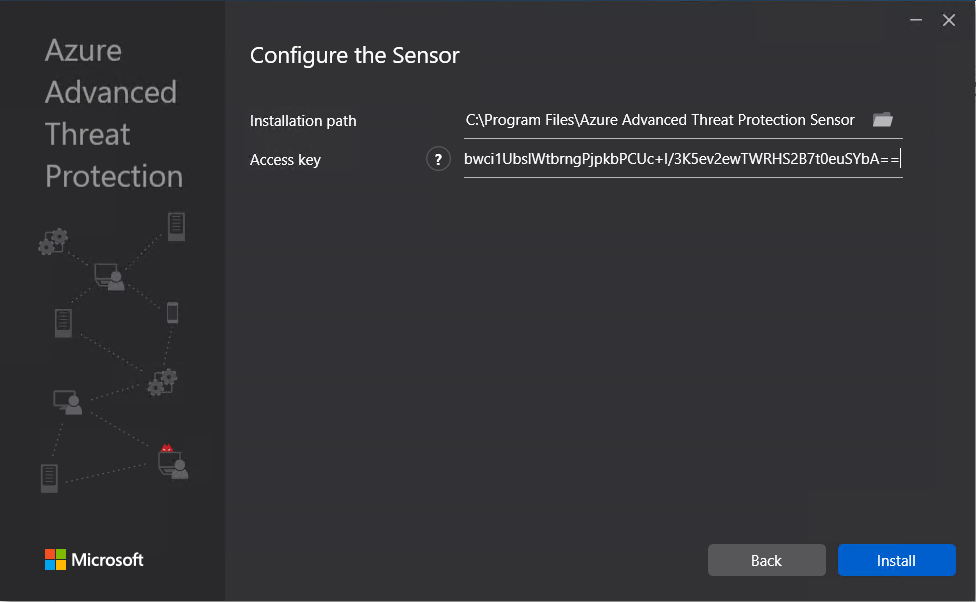 The agent should now start to install.
 Once the agent has install it can take some time for it to respond in Azure ATP.
 Now the agent should start to notify of any suspicious activity that run’s like reconnaissance on SMB, DNS and other malicious reconnaissance.
 We can also add sensitive account and group, there are default groups/ accounts that are considered sensitive by default like Administrators, Domain admins, Enterprise admins…, a full list of these can be found in the below link.
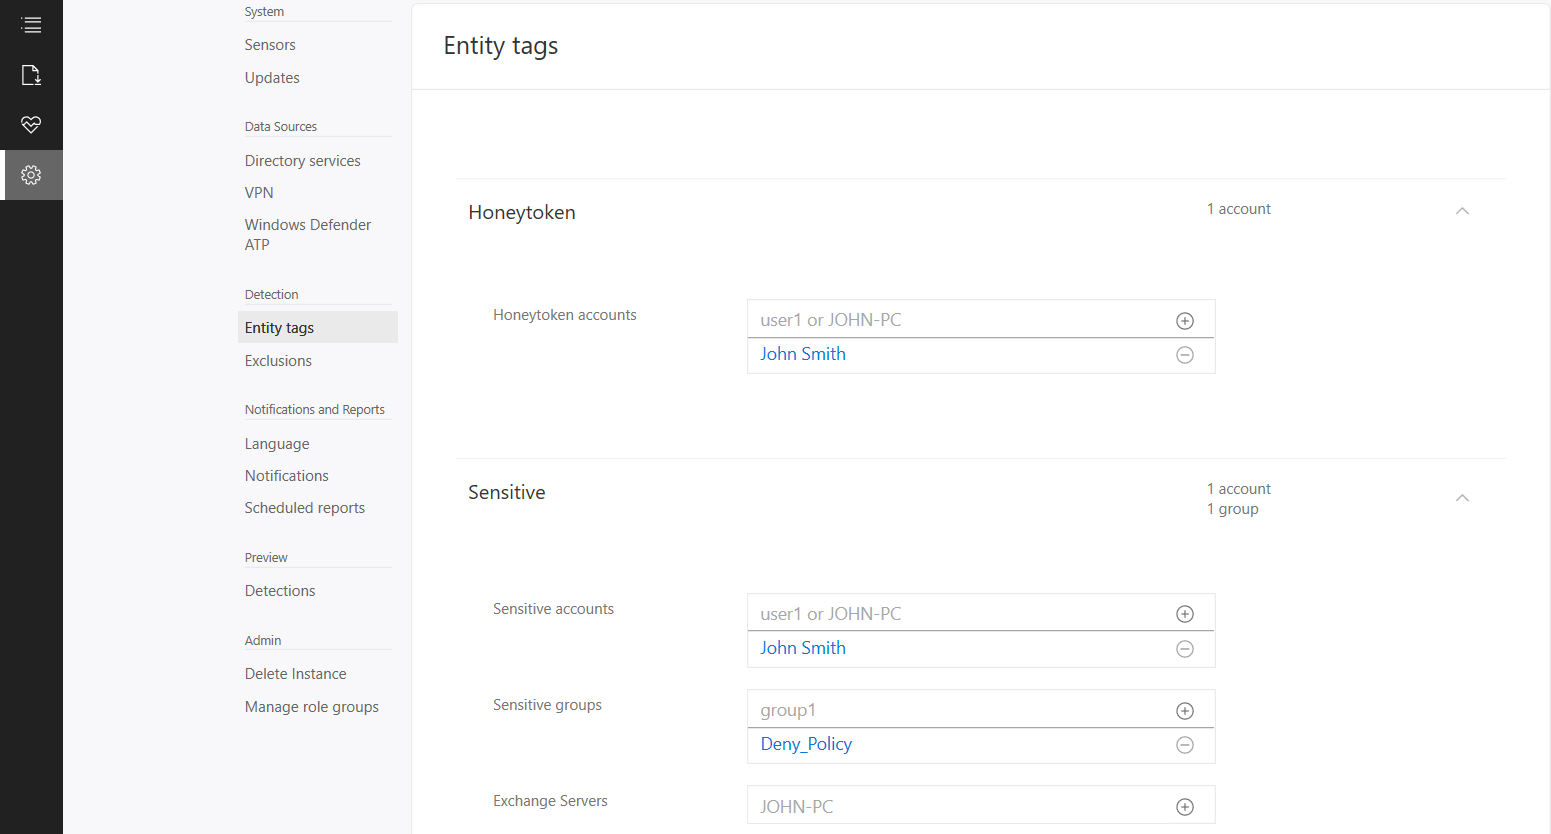 If we now logon with the HoneyToken account it will then alert the activity by this account.
 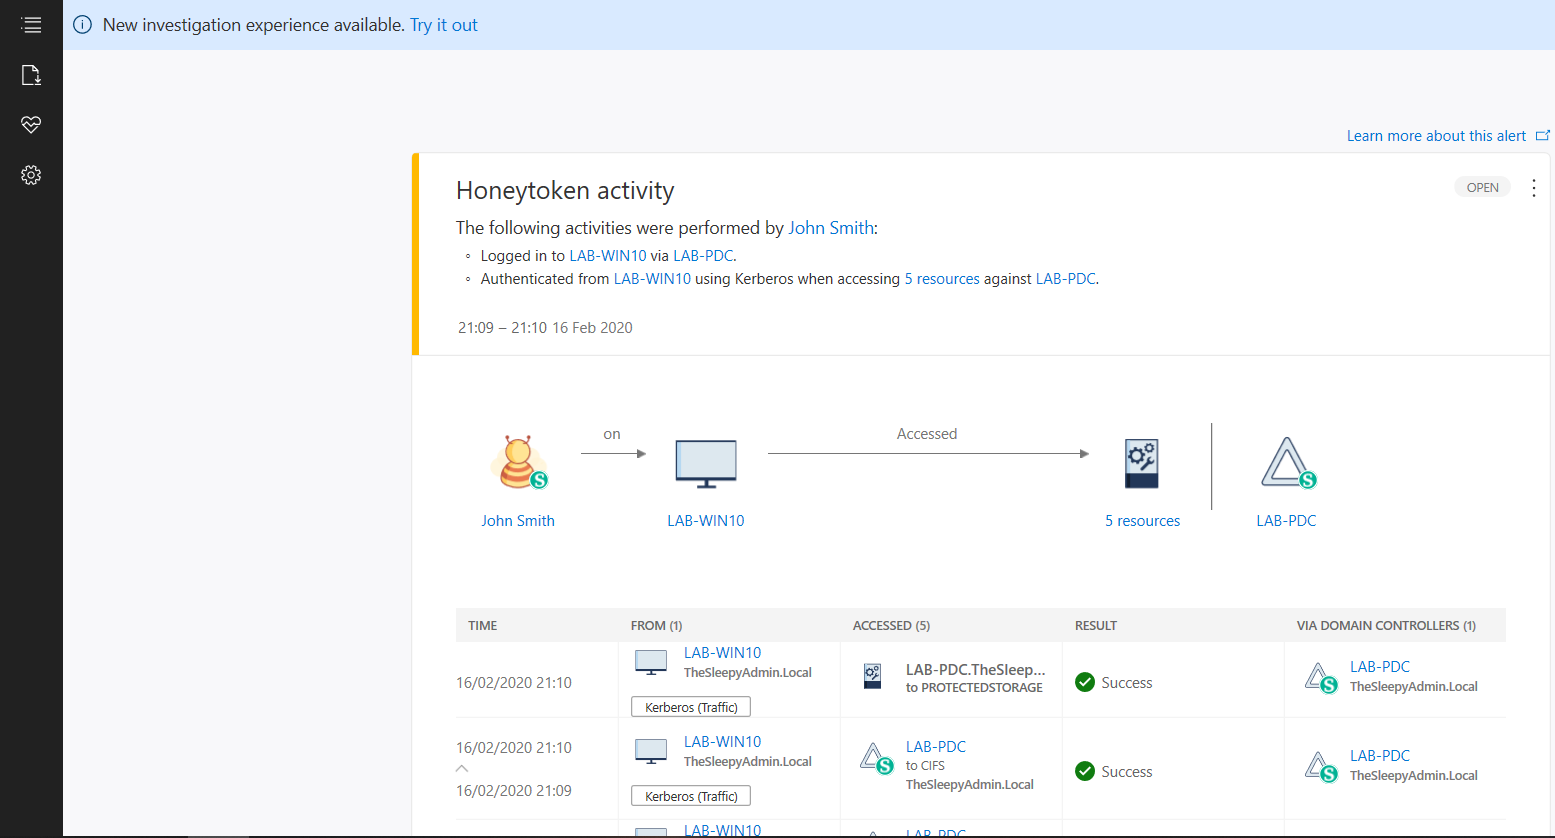 We can also run reports or schedule reports for schedule reports. To run a report go to the reporting blade and change the date to the range you want and click download.
 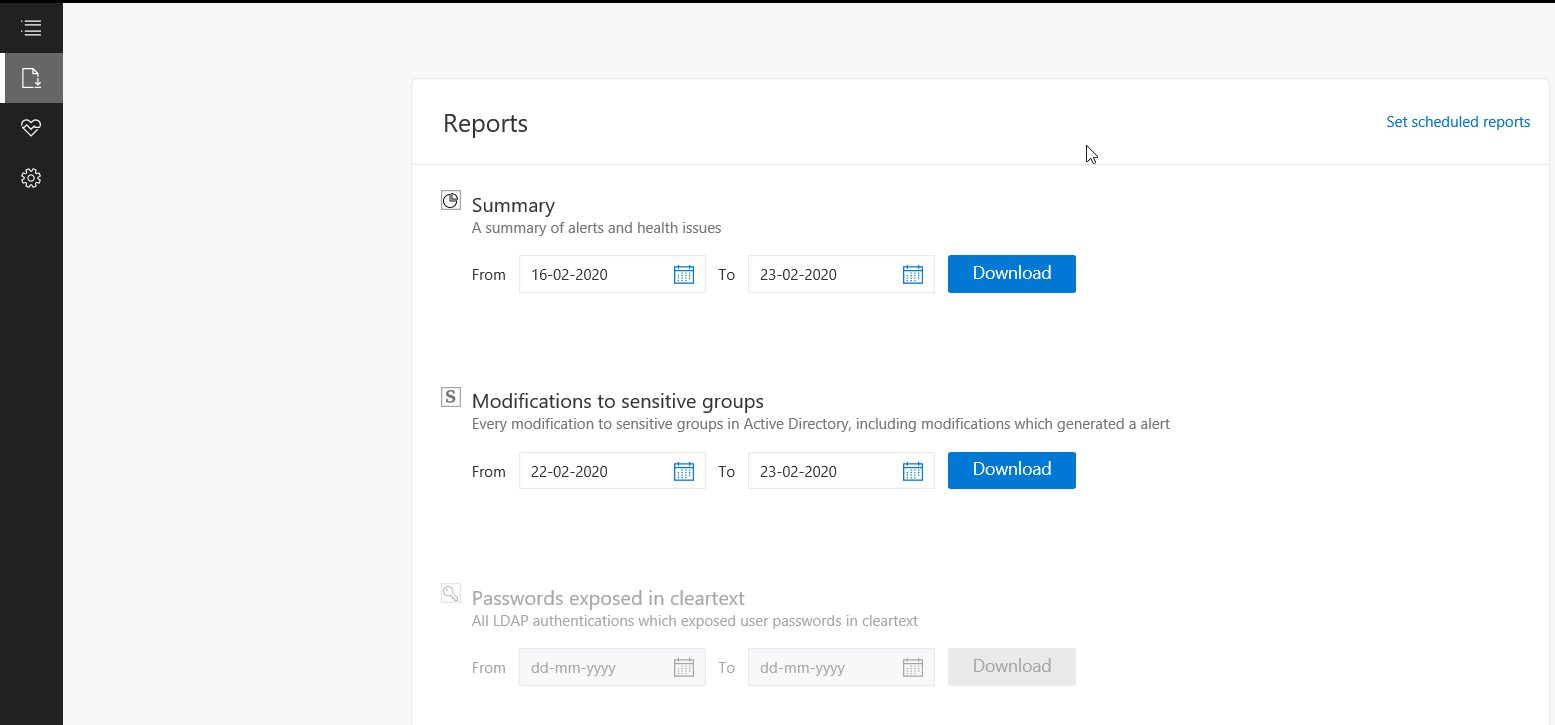 Below is an example of the modification to sensitive groups.
 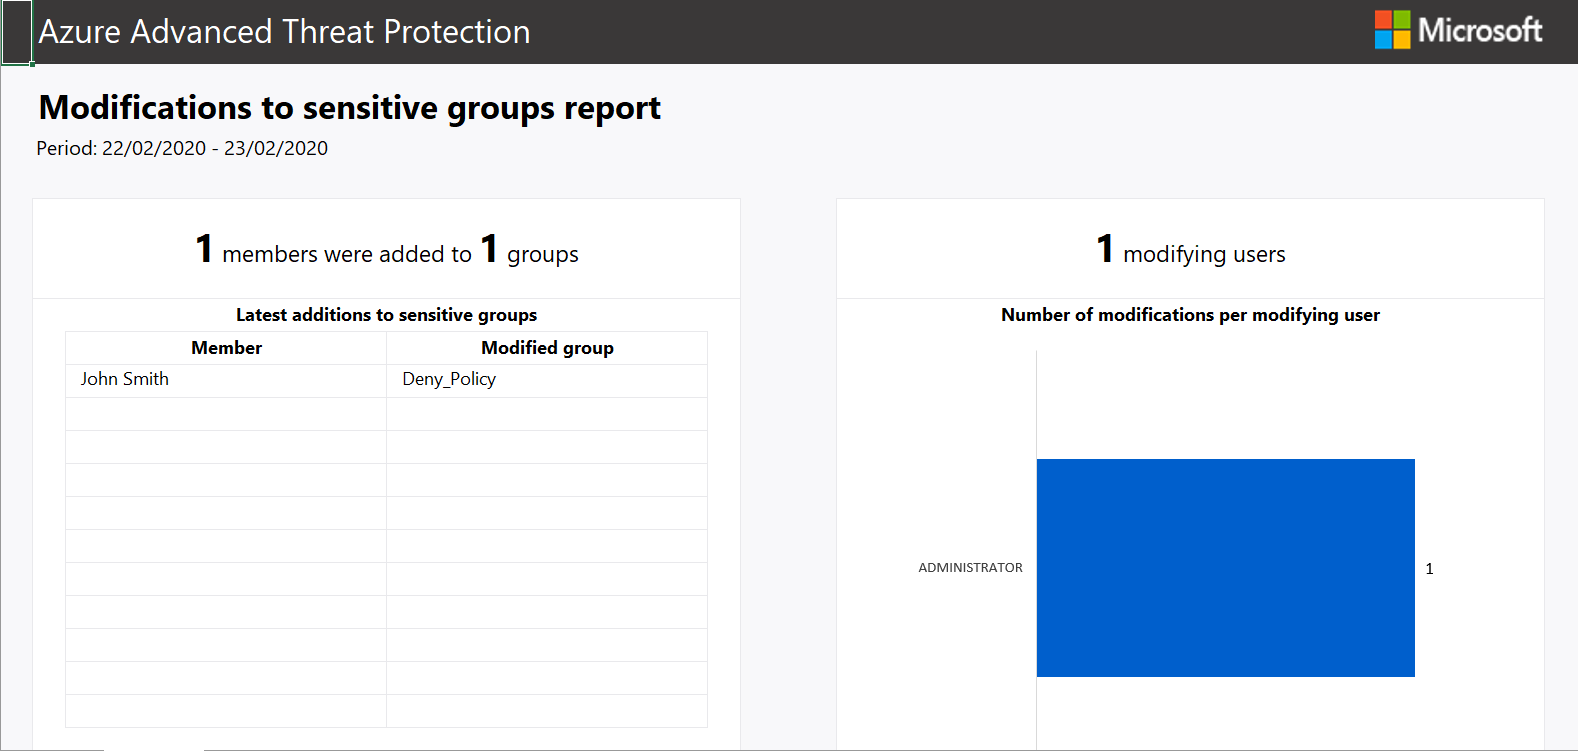 To scheduled reports go to configuration and scheduled reports.


